Flawed reasoning: The analysis used a metric called “vaccination-to-onset time” without accounting for the different lengths of time periods analyzed, thereby drawing invalid conclusions.

FULL CLAIM: VAERS data are “crystal clear”: “72% of the deaths in the history of VAERS are from the COVID vaccine”; the “vaccination-to-onset time” vaccine curve “means that the COVID vaccines are killing people”
REVIEW
The claim that COVID-19 vaccines are responsible for the deaths of many people is a recurring theme of disinformation that Health Feedback has refuted on previous occasions.
In yet another iteration of this claim, entrepreneur Steve Kirsch published an article on Substack in August 2023, in which he used data from the U.S. Vaccine Adverse Events Reporting System (VAERS), a database where anybody can report medical events occurring among vaccinated individuals, to claim that it was “crystal clear” that “the COVID vaccines are killing people”.
Kirsch has previously disseminated COVID-19 and vaccine disinformation, as we have documented. Here again, Kirsch’s analysis is riddled with inconsistencies and flaws. We’ll explain this in detail below.
VAERS data alone cannot be used to establish a causal relationship between vaccination and death
In one part of his analysis, Kirsch retrieved the number of deaths from any cause reported to VAERS among people who received a COVID-19 vaccine or any other vaccine. He then used that number to claim that “72% of the deaths in the history of VAERS are from the COVID vaccine” and that this vaccine “kill[s] 1 person per 1,000 doses”.
His reasoning, however, doesn’t work because the numbers Kirsch used don’t represent the number of deaths caused by vaccines. It merely represents the number of deaths that happened to be reported to the system and that occurred among people who happened to be vaccinated, regardless of the cause.
Indeed, VAERS isn’t designed to show that a given vaccine caused deaths. VAERS doesn’t aim to show causality between vaccination and a given medical condition, but to detect early signs of potential side effects.
The VAERS website explains: “VAERS is not designed to detect if a vaccine caused an adverse event, but it can identify unusual or unexpected patterns of reporting that might indicate possible safety problems requiring a closer look.”
Despite these warnings, those opposed to COVID-19 vaccination continue to incorrectly cite the VAERS database to support false claims about the dangers of COVID-19 vaccines, as we have reported on many occasions.
This warning is also repeated on the VAERS “data” webpage: “VAERS reports alone cannot be used to determine if a vaccine caused or contributed to an adverse event or illness”. It is repeated again as a pop-up message before accessing the query form used to retrieve data. It is thus difficult for anyone who wishes to use VAERS data to make any claims on vaccine-related mortality to ignore that caveat.
Therefore, the fact that a vaccinated person’s death is reported to VAERS alone doesn’t mean that the vaccine is responsible for the death. Consequently, the number of death reports post-COVID-19 vaccination cannot be used as a reliable starting point to calculate a hypothetical vaccine-related mortality rate. This is a major caveat that Kirsch completely overlooked. Science Feedback reached out to Kirsch to inquire about these methodological questions; the review will be updated if additional information becomes available.
VAERS cannot be used to directly compare COVID-19 vaccines to other vaccines
Furthermore, Kirsch didn’t take into consideration another bias that invalidates his comparison between the COVID-19 vaccine and other vaccines: that the regulations regarding adverse event reporting are different for the COVID-19 vaccines compared to other vaccines. Indeed, the VAERS website explains that healthcare professionals are required to report deaths that occur after COVID-19 vaccination regardless of the cause.
By contrast, healthcare professionals are only required to report the deaths after other vaccines when the causes are listed in the VAERS Table of Reportable Events Following Vaccination. These are mostly deaths due to complications of rare, but recognized, short-term side effects of vaccinations, such as anaphylactic shock or fainting.
Therefore, health practitioners must report all the deaths occurring among people who received the COVID-19 vaccines, but only some of the deaths occurring among people who received another type of vaccine—let’s remember that this doesn’t mean that any of these deaths were known to be caused by vaccination. As a result, it is extremely likely that this difference explains, at least in part, why there are more deaths reported among people who received the COVID-19 vaccine.
Finally, that comparison doesn’t account for the demographic differences between recipients of different vaccines. COVID-19 vaccines were prioritized for older and frailer people because they were more vulnerable to COVID-19. These groups are at a higher risk of dying—of old age or because of health complications—than the rest of the population.
By contrast, many other vaccines are administered during childhood, like the DTP vaccine or the MMR vaccine. Children have a much lower risk of dying from any cause than older people. Therefore, it is logical that fewer deaths are reported in that category.
The “vaccination-to-onset” curve, once corrected for bias, doesn’t show that the COVID-19 vaccine is dangerous
In another part of his analysis, Kirsch presented a graph that supposedly “means that the COVID vaccines are killing people”. Once again, the reasoning is flawed. To understand why, we must first explain the rationale behind this.
The graph represents what Kirsch called the “vaccination-to-onset time” curve. This is the distribution of the reported all-cause deaths among people who received a specific vaccine, according to the elapsed time between vaccination and death. Thus, the point “0 day” corresponds to the people who died from any cause the same day they got their vaccine; “1 day” corresponds to the people who died from any cause the day after, and so on.
Kirsch claimed that the shape of that curve would help determine if a vaccine is safe or not, writing that “a safe vaccine should have a peak near day 0 just due to coincidence causing false reports in the first few days after the vaccine as people falsely associate the death event with the date of vaccination. The rest of the curve should be flat”.
In other words, his reasoning is as follows: if a vaccine is safe, deaths should randomly occur with respect to the vaccination date. So, we would expect the same number of deaths at any time points after vaccination, except for the first few days following vaccination, where people would mistakenly attribute any unrelated deaths to the recent vaccination. Hence Kirsch suggested that a curve with an initial peak and a somewhat flat shape afterward is the mark of a safe vaccine.
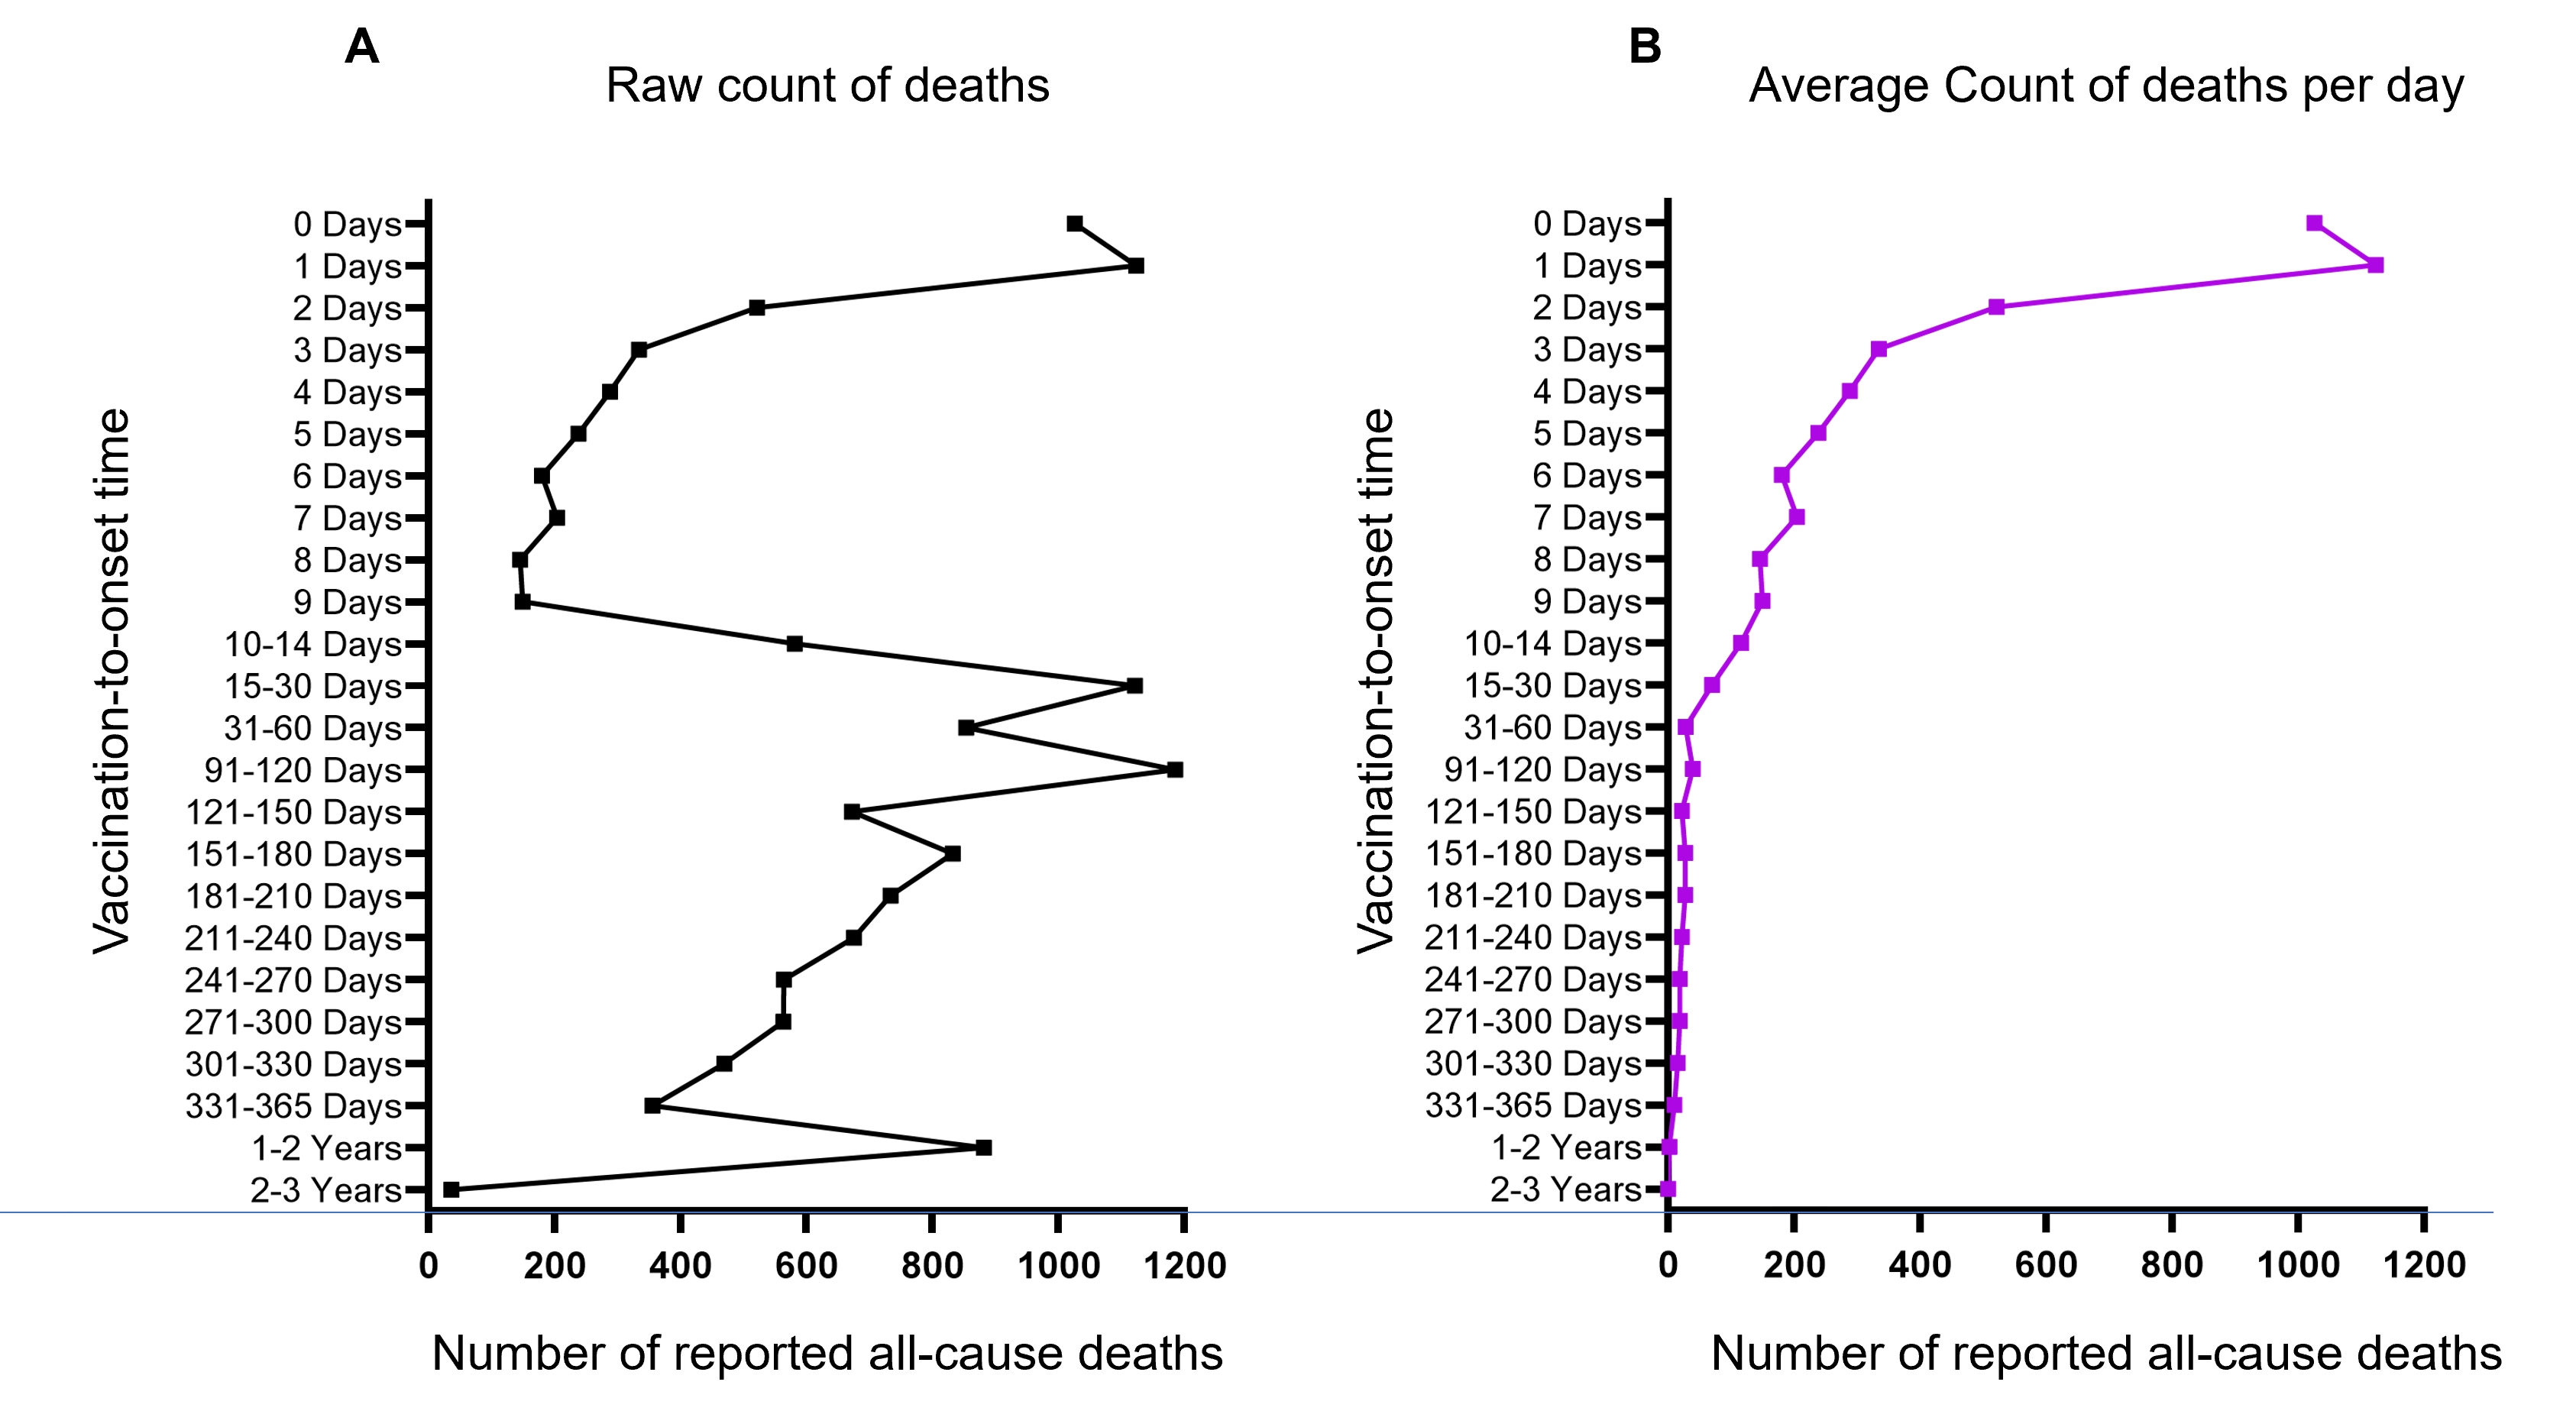
However, this analysis is fundamentally flawed as the data points don’t represent the same length of time. For example, the data point “15-30 days” would plausibly include more deaths simply because it is a longer period—sixteen days—than a single-day data point like “5 days”.
Therefore, the number of reported deaths at points “5 days” and “15-30 days” may differ simply because the latter includes deaths occurring over a longer period than the former. Thus, raw numbers of deaths for a single day aren’t comparable to the total raw number of deaths within a period of multiple days.
To account for this bias, we reproduced Kirsch’s graph in Figure 1A, using the same methods provided in Kirsch’s post to retrieve the VAERS data. Numerical figures are slightly different owing to the regular updates of the VAERS database that occurred after Kirsch’s analysis.
For data points corresponding to a single day, like “5 days”, we used the same number in Kirsch’s graph. In contrast, for data points corresponding to a period of multiple days, like “15-30 days”, we used instead the average number of reported deaths per day during that interval. In the case of the “15-30 days” data point, the average amounts to about 70 reported deaths per day (1122 total reported deaths over that period, divided by 16, the number of days in that time window).
The result of our analysis can be seen in Figure 1B below.
The COVID-19 vaccine curve, as shown on Kirsch’s graph, has several peaks instead of just one at the “0 days” point (Figure 1A). Because the curve didn’t fit the shape of what Kirsch considered a safe vaccine, he concluded that “the COVID vaccines don’t look at all like a safe vaccine: the peaks of deaths just keep going and going”.

Figure 1. Elapsed time between COVID-19 vaccination and death from any cause as reported in VAERS. A: Data retrieved according to Kirsch’s methodology, comparable to the graph in Figure 1 of Kirsch’s post. B: The same data after correcting for the time interval difference between data points.
But by comparing Figure 1B with Figure 1A, one can see that taking into account the difference in time interval between the data points removes the peaks. In other words, Kirsch’s claim that the “vaccination-to-onset time” curve for the COVID-19 vaccine was a clear mark of a deadly vaccine was based on a flawed, uncorrected curve. Once corrected for the time interval bias, the curve actually fits Kirsch’s criterion for what a safe vaccine would look like.
Conclusion
The VAERS database is a useful tool for pharmacosurveillance as it helps detect unusual patterns of adverse events. However, this tool has limitations that must be taken into account before drawing conclusions.
As Health Feedback explained previously, VAERS doesn’t show that vaccines are causing any of the reported adverse events, including deaths. VAERS cannot be used to directly compare the COVID-19 vaccine with other vaccines because the reporting rules are different.
Therefore, VAERS isn’t designed to support the claim on COVID-19 safety by Steve Kirsch. Furthermore, Kirsch’s claim relied on a flawed analysis of the elapsed time between vaccination and death reporting to VAERS. Once this analysis is corrected for bias, this metric doesn’t support the claim anymore.


