Inadequate support: The video claims that Sweden has reached herd immunity based on the fact that the death rate is not abnormally higher than in other countries. However, no data is presented to support that claim.
Lacks context: Several comparisons of key epidemiological metrics are made without providing the necessary details such as which metrics are actually analyzed and the time points included in the comparison. Looking at the whole trend instead of focusing on isolated time points shows that both COVID-19 positivity and daily COVID-19 death rates are going up in an accelerating fashion in October 2020.

FULL CLAIM: infection rate increased in October 2020 relatively to April while positivity dropped. Death rate dropped in October 2020 compared to April. The lower October death rate in Sweden indicates that the country has reached herd immunity. “the reason why the death rate is so low is because our body has another way to create immunity that goes beyond just the antibodies, it’s called the memory T cells”
REVIEW
Claims questioning the mortality or death toll from COVID-19 have recurrently appeared since the onset of the pandemic in early 2020. A video published in October 2020 by chiropractor Eric Berg, who is not a medical doctor and has no background in immunology, epidemiology or virology, claimed that the death rate of COVID-19 is decreasing based on a comparison of the number of cases and deaths of April 2020 and October 2020. Berg, who was reprimanded by the Virginia Board of Medicine in 2008 for violating regulations governing chiropractic practices, alleges in the video that the decrease in the COVID-19 death rate is due to people having preexisting immunity to the virus. The original video on YouTube received more than 230,000 views to date and went viral on Facebook. Health Feedback reviewed the main points of this video.
Claim 1 (Lacks context): The COVID-19 infection rate increased between April and October 2020
Berg reports an increase in “infection rate” between April and October 2020 in a selected group of countries, including the U.S., France, the U.K., Italy, Germany, Spain, Belgium, and Sweden. According to the video, this data is from Our World in Data, a website that compiles and summarizes data on COVID-19 cases, deaths, and other epidemiological factors. An infection rate of a disease is calculated from the number of infections that occurred over a specific duration of time.
However, Berg never specified the duration for which he was calculating the COVID-19 infection rate. For example, it was unclear whether his estimate was based on the number of COVID-19 infections per week or per month.
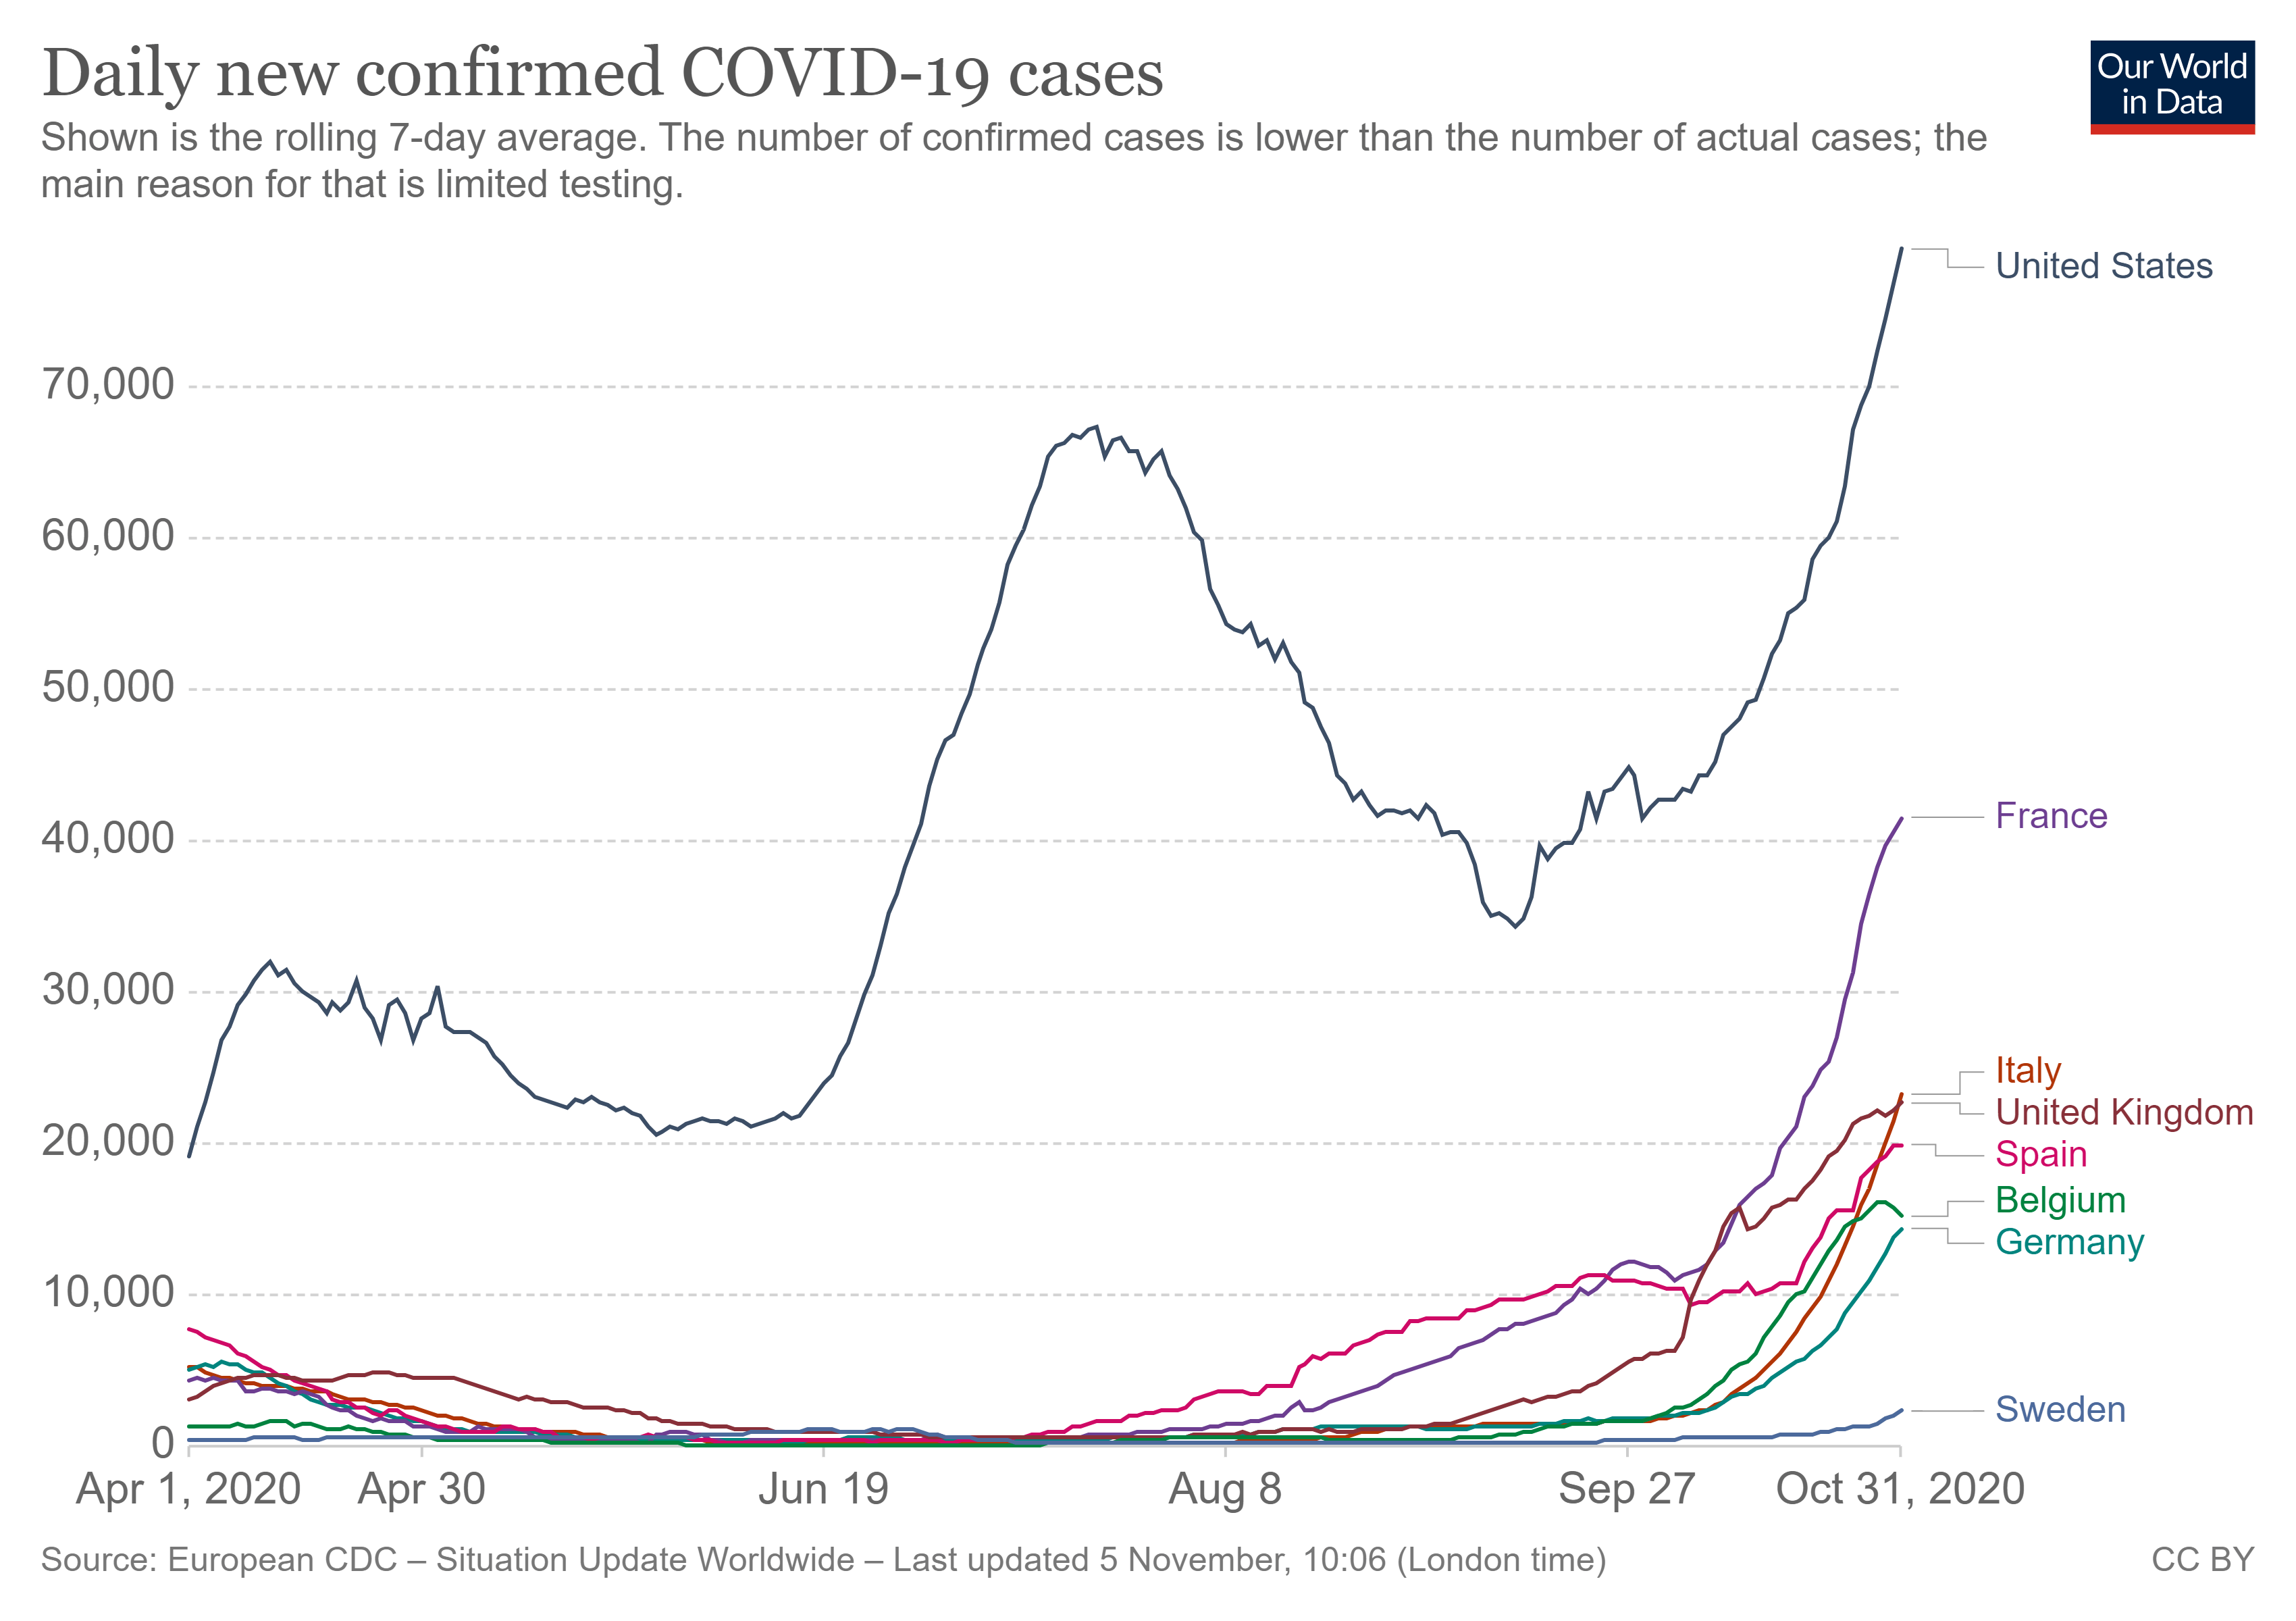
It is possible that what Berg referred to as an “infection rate” is the daily infection rate, which is a commonly used metric for the ongoing pandemic (Figure 1). Overall, daily infection rates of October 2020 are actually higher than those from April. However, Berg did not specify from which day of April to which day of October the comparison is made. It is thus difficult to precisely assess the accuracy of the numbers presented in the video.

Figure 1: Daily number of confirmed COVID-19 cases in selected countries (rolling average over seven days). Data from Our World in Data.
Claim 2 (Misleading): The COVID-19 death rate decreased between April and October 2020
Berg also states that COVID-19 death rates decreased in the selected countries between April and October 2020. As with the first claim, Berg does not specify which metric he is using to arrive at this conclusion, nor does he provide the exact dates used for the comparisons.
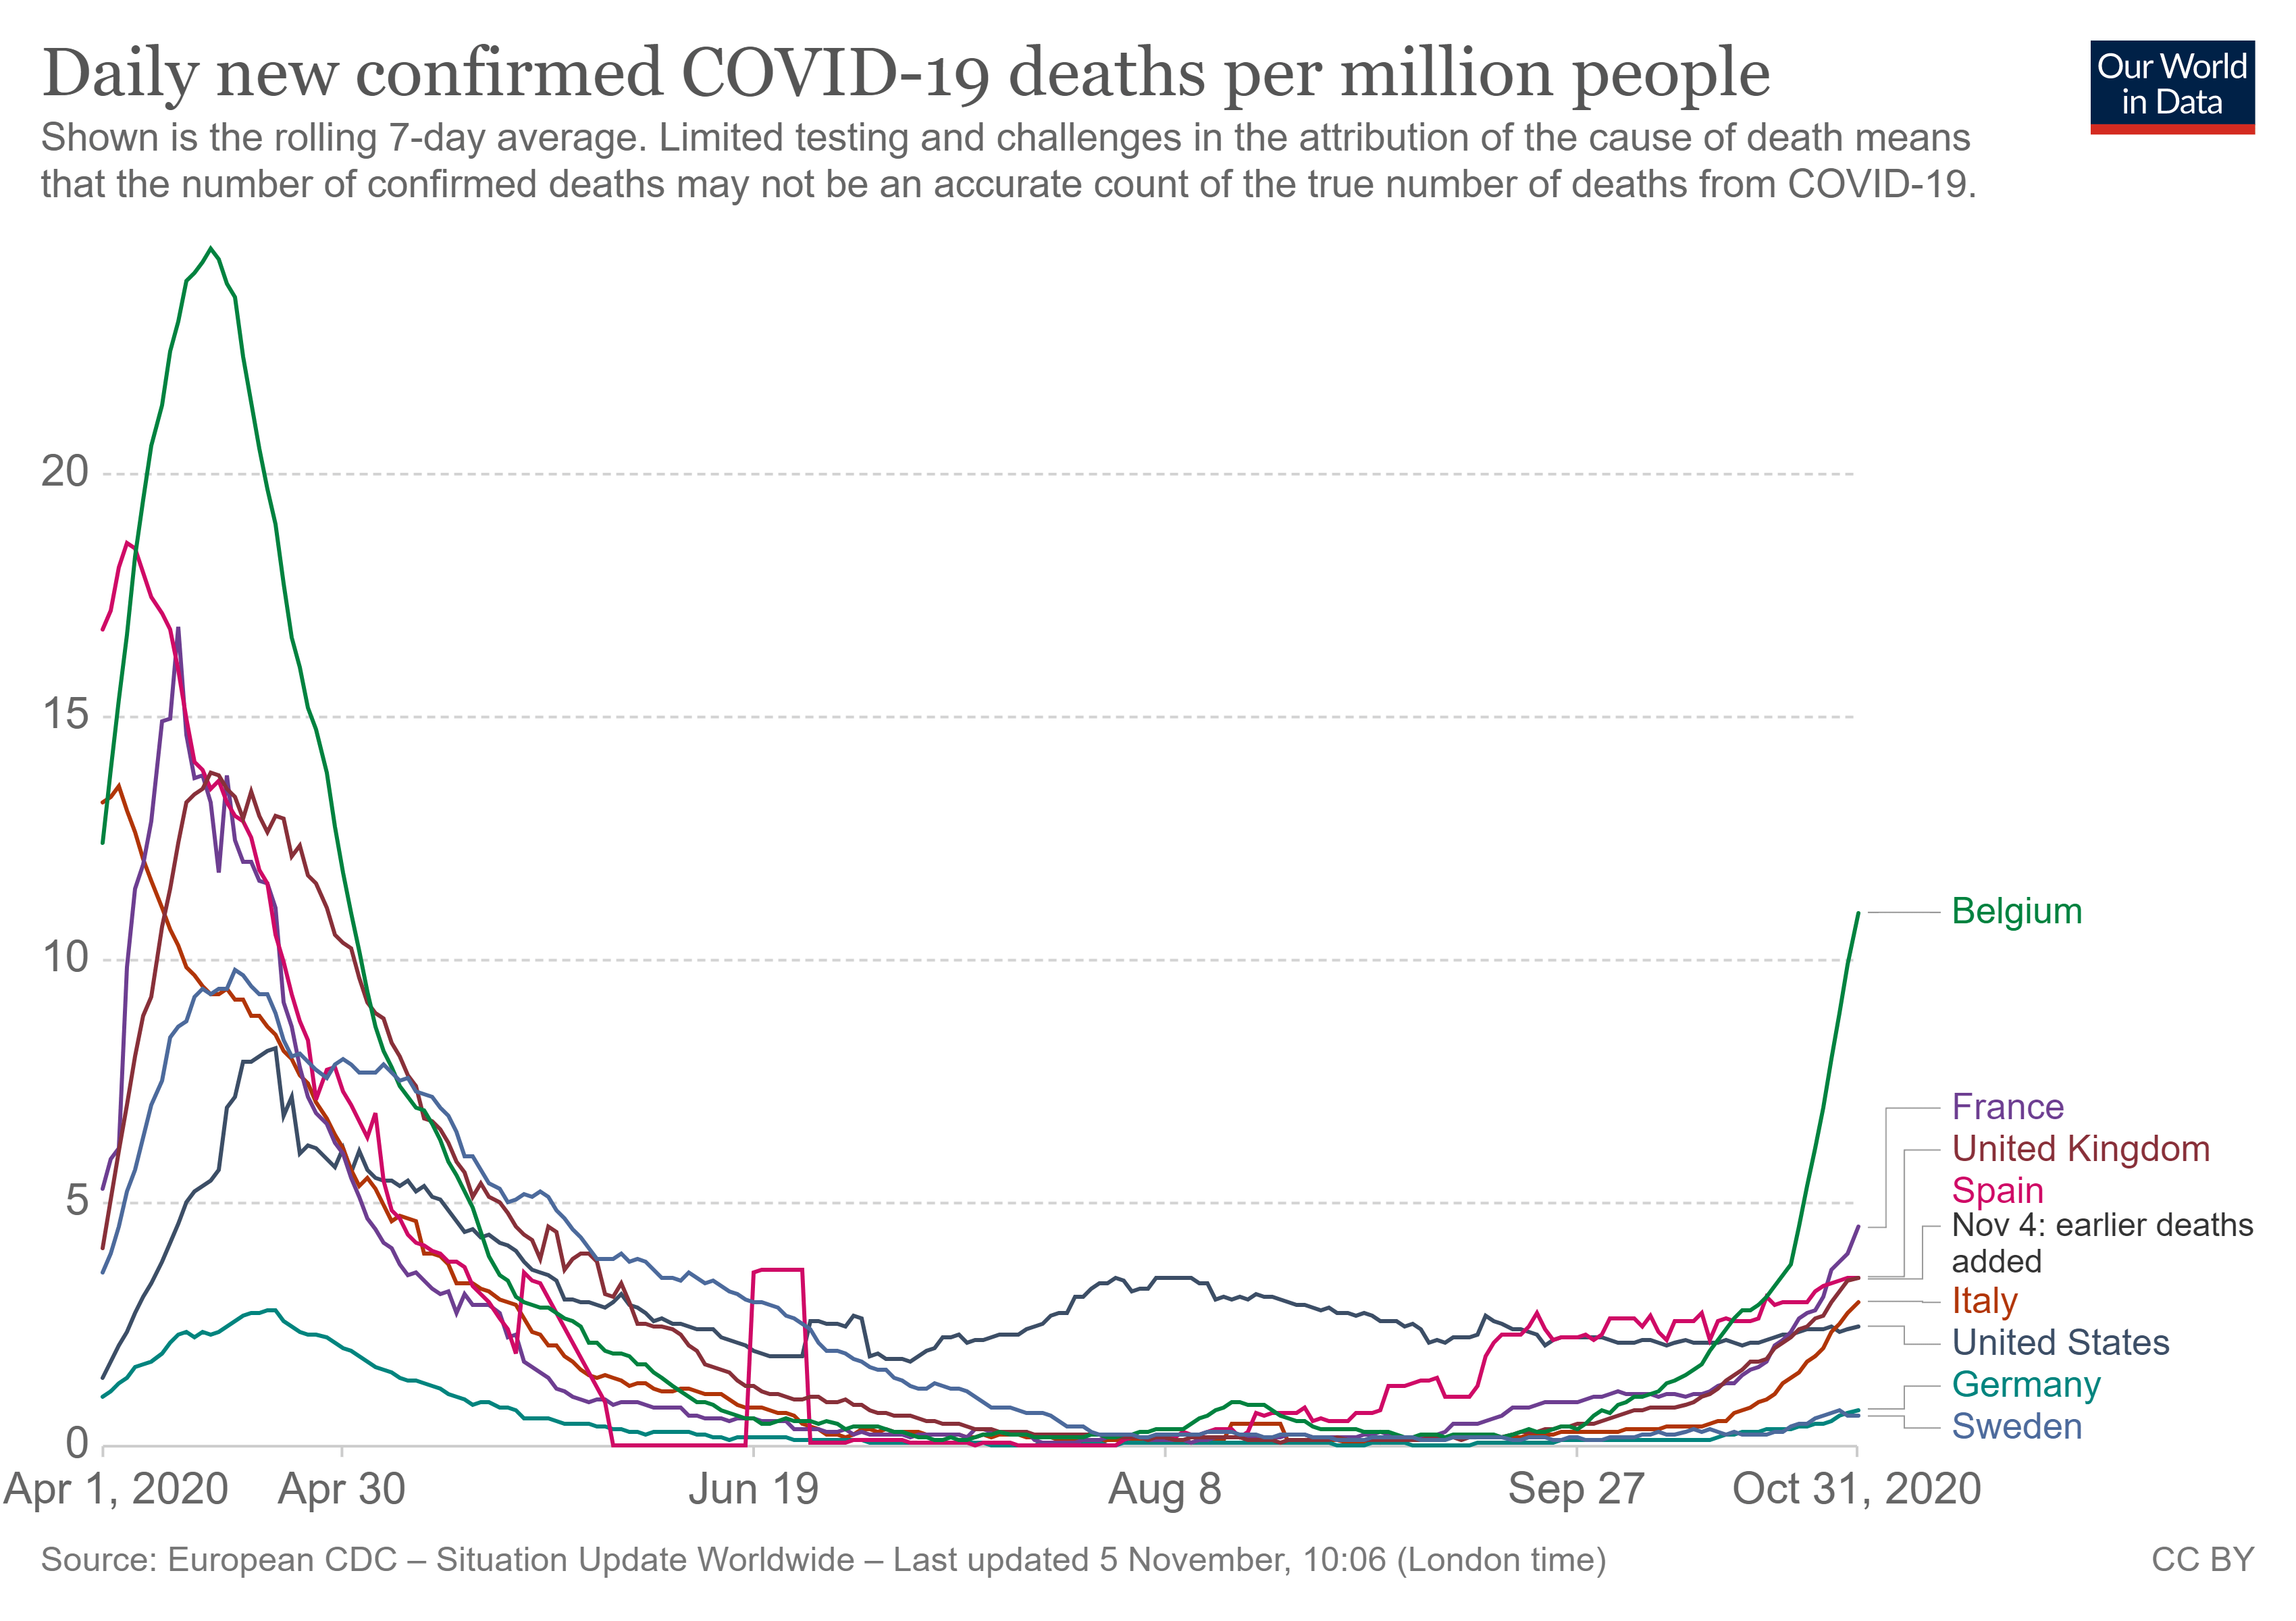
While the COVID-19 death rate was lower in October 2020 than April 2020, this comparison is misleading because two time points do not provide an accurate account of the overall death rate trend. For instance, in Belgium, the daily death rate in late April is higher than that of later October. However, when looking at the overall trend, late April showed a declining death rate, whereas the number of people who died from COVID-19 continuously increased each day in October (see Figure 2 below).
As seen in Figure 2, the daily death rate for the selected countries is lower overall in October than April, but the trend is increasing. By overlooking the trend in COVID-19 death rate over time, the video may mislead viewers.

Figure 2: Daily number of confirmed COVID-19 deaths per million people in selected countries (rolling average over seven days). Numbers are normalized by the size of the population. Data from Our World in Data.
Claim 3 (Flawed reasoning): “Positivity rate is how high the virus is transmitting”
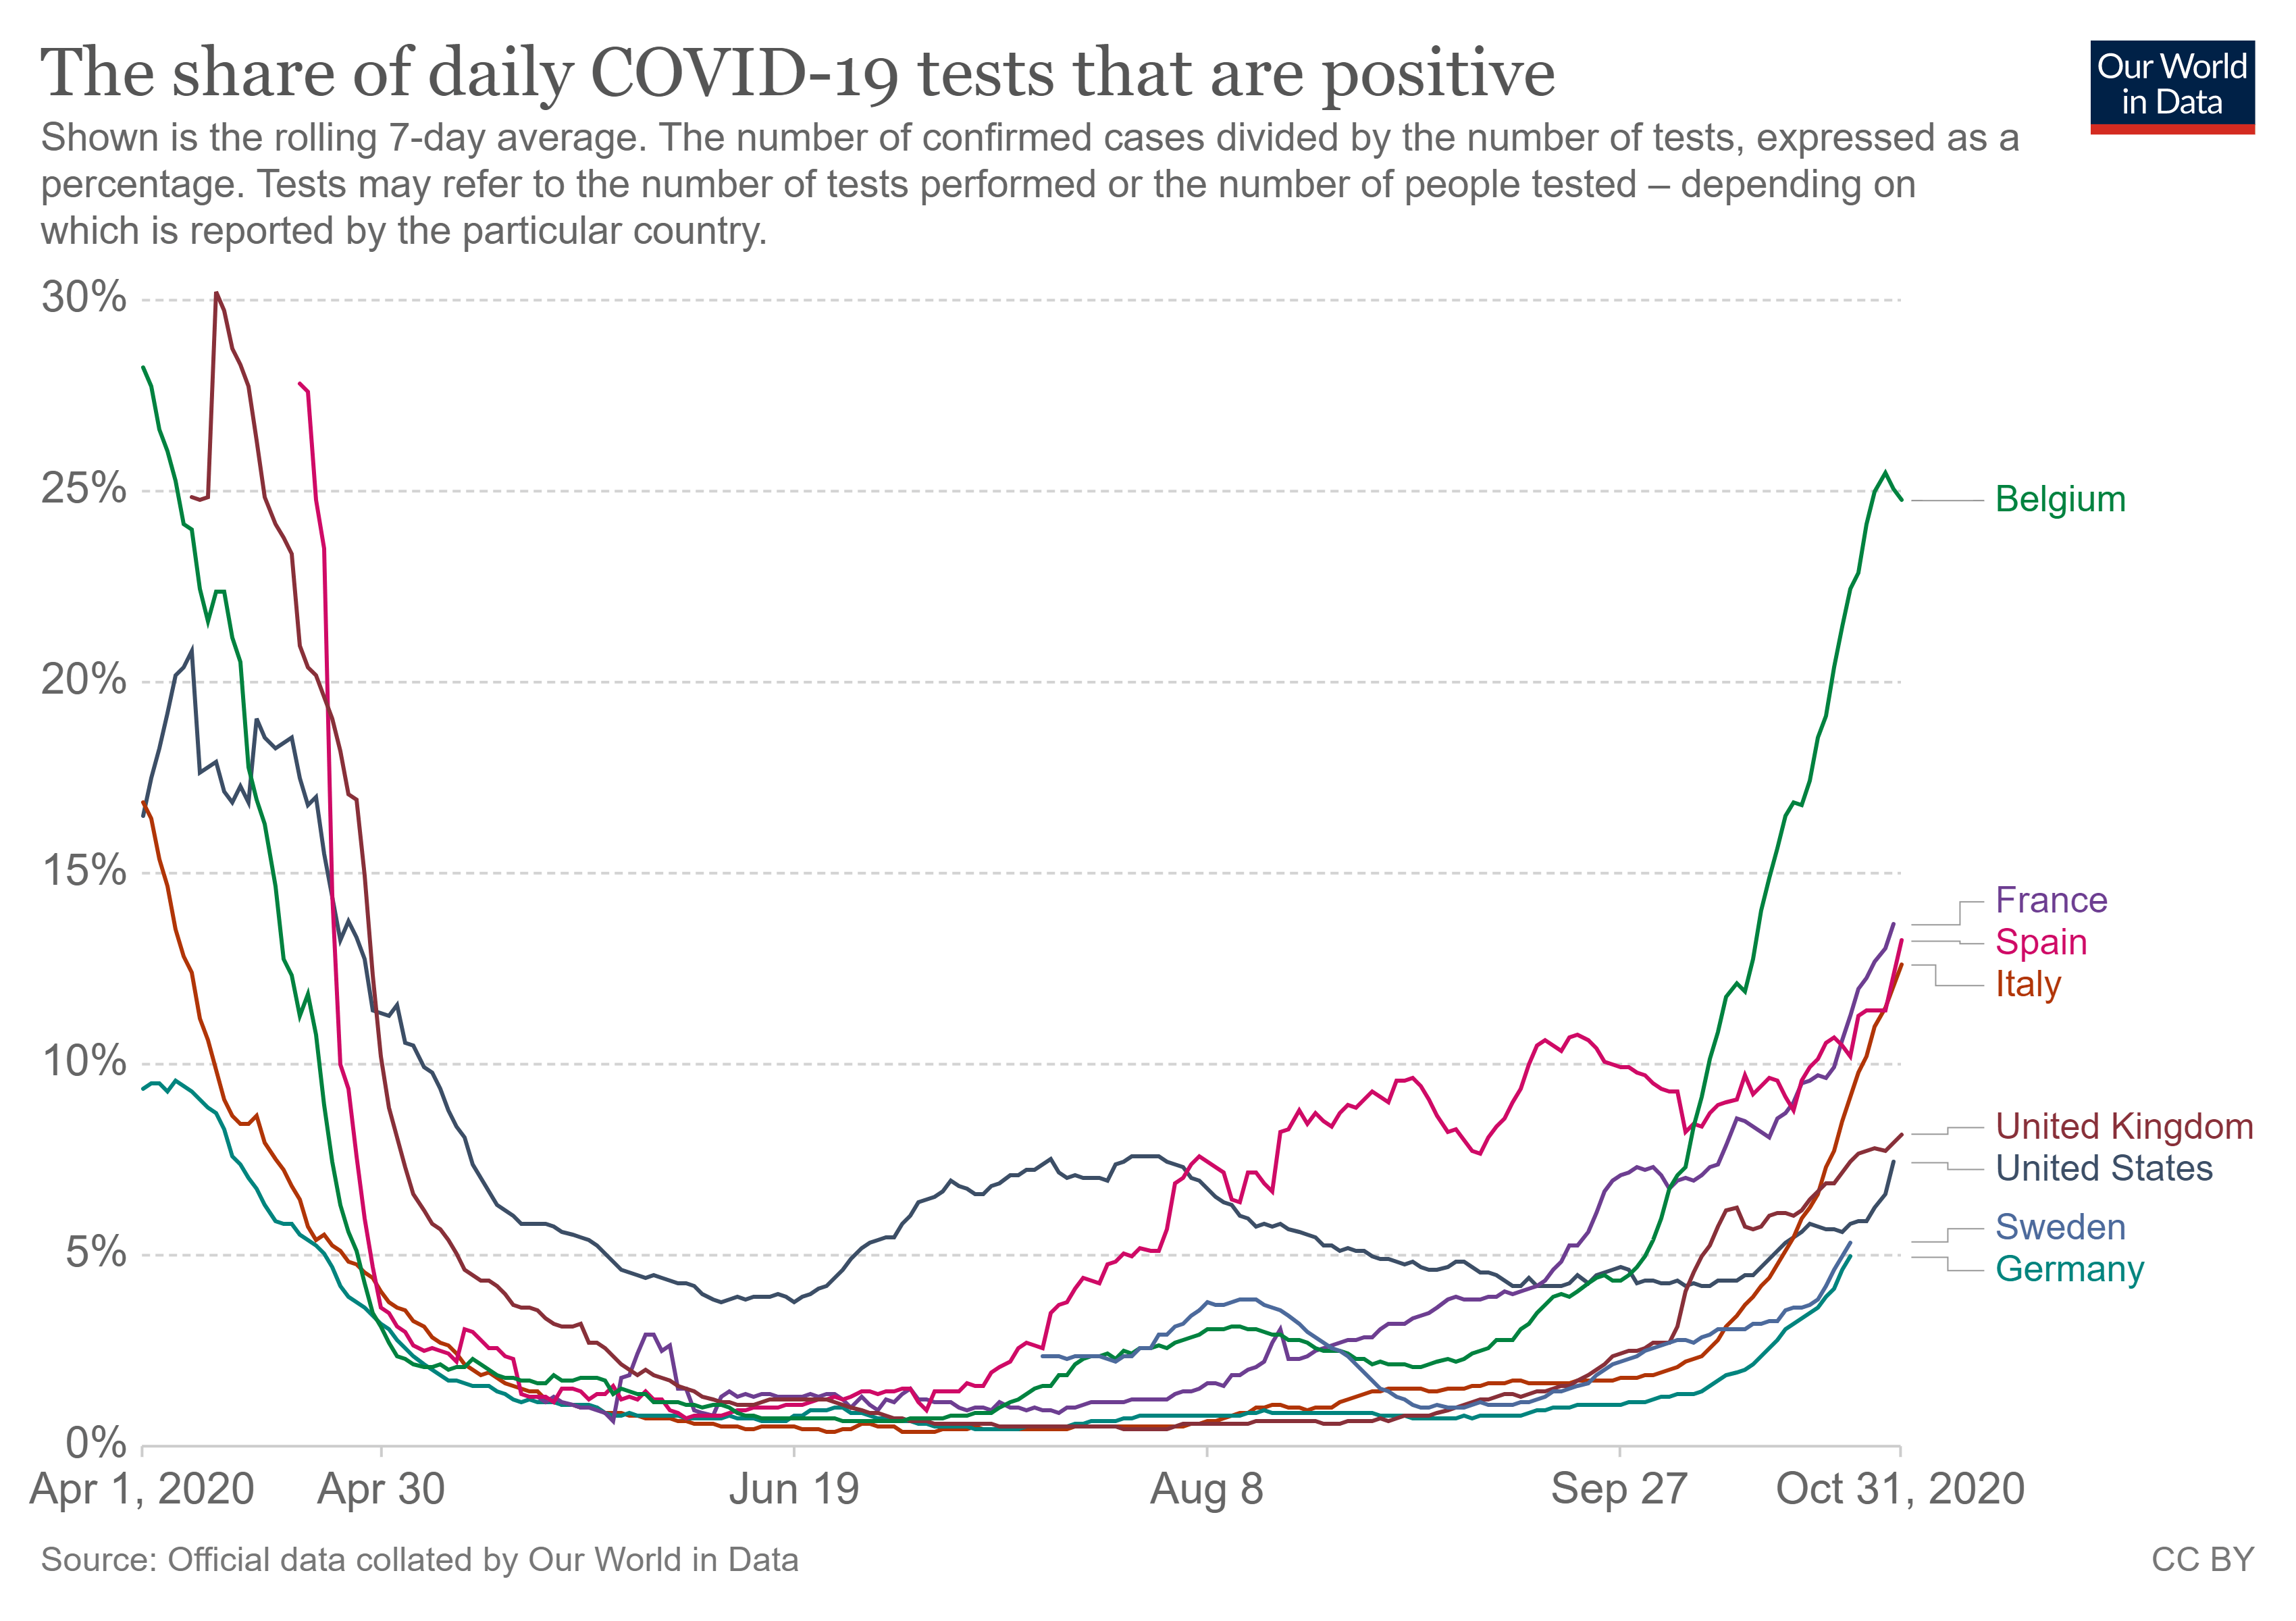
Later in the video, Berg looks at the evolution of the number of detected infections and the positivity rate (Figure 3), that is the ratio of diagnostic tests returning positive results to the total number of tests performed. This rate indicates how many people who were tested are infected with SARS-CoV-2. Berg uses flawed reasoning by claiming that positivity represents “how high the virus is transmitting” and concludes from the lower positivity of October 2020 that the virus is transmitting less than in April.
The positivity rate may change depending on the characteristics of the population being tested. For example, if tests are only performed for people with symptoms that are consistent with COVID-19, the positivity rate will be high, as this testing strategy selects for people who are very likely infected.
By contrast, if testing is done on random people within a population, the positivity rate will be lower, as this testing strategy likely includes more people who are not infected. Due to differences in testing strategies, the positivity rate does not always accurately measure how widespread the virus is among a country’s population.
Furthermore, many countries changed their testing policies from focusing on symptomatic people between March and April 2020 to a testing policy open to everyone during the fourth quarter of 2020, as visualized by Our World in Data. As stated above, this shift in testing policy influences the resulting positivity rate. Therefore, a decreased positivity rate between April and October 2020 does not necessarily reflect decreased circulation of the virus.
Similar to the previous claims, Berg only compares the positivity rate in April and October 2020. By doing so, Berg overlooks the fact that the positivity rate in October is accelerating.

Figure 3: Daily positivity rate, which is the proportion of daily COVID-19 tests which returned a positive result, in selected countries. Data from Our World in Data.
Claim 4 (Unsupported): “[Sweden] developed herd immunity”
Sweden did not implement a lockdown as part of its strategy to address the COVID-19 pandemic, yet it did not experience a much higher death toll compared to other countries. Based on this, Berg claims that Sweden achieved herd immunity, which is a state where a certain proportion of people in a community developed immunity to a disease-causing microorganism, either through infection or vaccination. When this group of immune individuals is large enough, the virus can no longer spread in a community as there are not enough vulnerable hosts to transmit the infection, thereby stopping the epidemic.
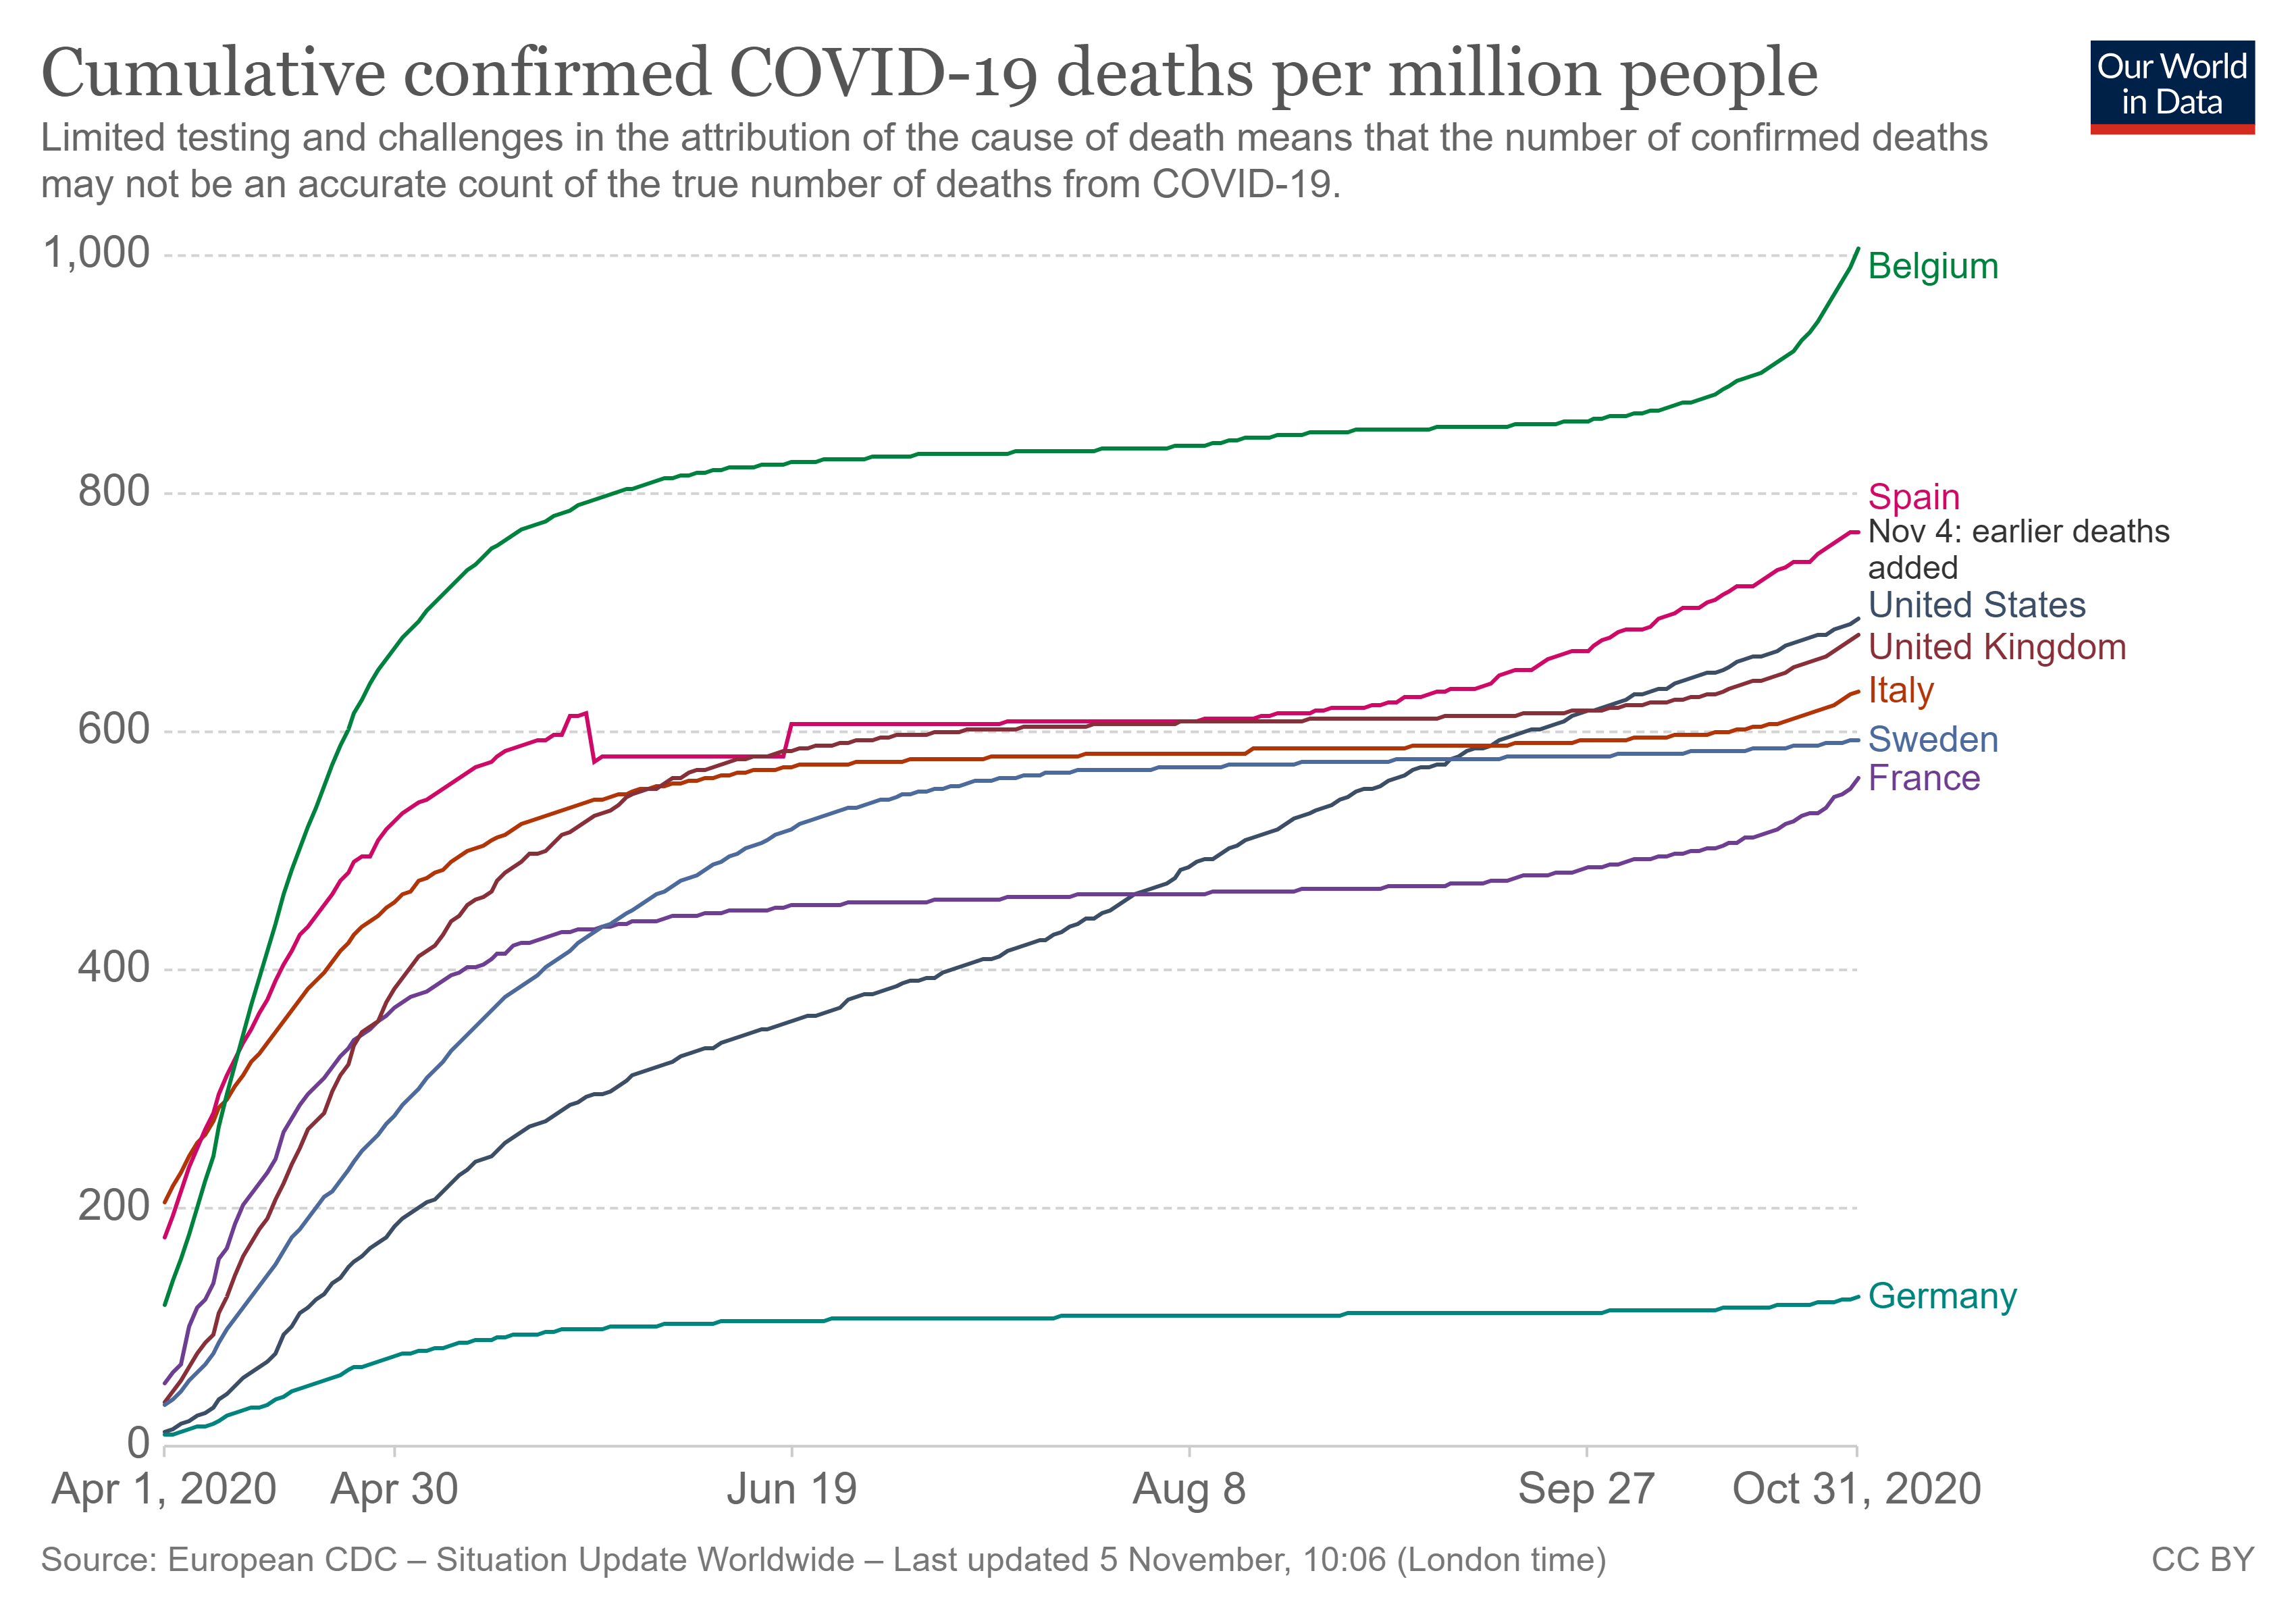
However, the claim that Sweden has reached herd immunity is unsupported by available data. Sweden’s death toll is comparable to many other countries (see Figure 4 below). Compared to Sweden, the total number of COVID-19 deaths per million inhabitants is lower in France and was lower in the U.S. until September 2020. Although Sweden’s approach did not lead to a noticeably higher death toll than other countries, it did not lower the death toll compared to other countries either.

Figure 4: Cumulative number of deaths per million people for selected countries. The graph represents the total number of confirmed deaths to COVID-19 since the beginning of the pandemic. Data from Our World in Data.
The exact number of immune people needed to achieve herd immunity is unknown and depends on several factors, such as models of virus propagation as well as the duration of a person’s immunity to COVID-19. A news article published by Science reports that at least 40 to 70% of the population needs to be infected to develop herd immunity, but so far, only 6 to 8% of the Swedish population tested positive for antibodies against COVID-19. The more the contagious a virus is, the more people need to be infected in order to reach herd immunity. Similarly, serological studies reported that 7.5 to 10% of people in Sweden displayed signs of past COVID-19 infection[1]. The video presents no new evidence to support Berg’s claim that Sweden developed herd immunity.
One possible explanation of why the mortality rate in Sweden was similar to those of other countries is that many Swedes voluntarily stayed at home and respected physical distancing measures, even in the absence of official lockdown decisions. For instance, Sweden’s chief epidemiologist Anders Tegnell reported that many Swedes reduced their social interactions by 30% in July 2020 relative to before the pandemic, according to this BBC article. In addition, more than 80% of the population followed physical distancing measures.
Claim 5 (Unsupported and Flawed reasoning): The reason why the death rate dropped between April and October 2020 is due to a preexisting T cell immunity
Overall, the mortality rate of COVID-19 dropped during the second semester of 2020. As an explanation to this, Berg posits that “the death rate dropped so low” because of preexisting immunity to SARS-CoV-2, the virus that causes COVID-19. To support his claim, he cites a published study reporting that the T cells of some people who were never infected with the virus were able to detect the presence of SARS-CoV-2. T cells, or T lymphocytes, are a type of white blood cell that plays a central role in a person’s immune response against pathogens.
Berg’s association of cross-reactive T cells with the alleged drop in mortality between April and October 2020 is flawed. Cross-immunity is due to past infection with other coronaviruses that cause the common cold, therefore it must predate the COVID-19 pandemic. If cross-reactive T-cells did provide protection against COVID-19, then the protection would have been evident before April. Due to this, cross-reactive T cells cannot explain the lower mortality observed in October 2020 relative to April.
As Health Feedback explained in an earlier review, the study cited by Berg reports that T cells from a certain proportion of people who never had COVID-19 could nevertheless recognize SARS-CoV-2 proteins[2]. Further research demonstrated that these SARS-CoV-2 reactive T cells were the result of past infections with other types of coronaviruses that cause the common cold[3].
This cross-reactivity is due to the fact that members of the coronavirus family share identical or similar proteins. Therefore, T cells that previously encountered a common protein on one coronavirus can recognize that protein on a different coronavirus. Based on the findings from these studies, Berg concludes, “the reason why the death rate is so low is because our body has another way to create immunity that goes beyond just the antibodies, it’s called the memory T cells”.
However, scientists still do not know whether cross-reactive T cells protect against COVID-19. Misunderstandings about the implications of cross-reactive T cells led Shane Crotty, an immunologist and professor at the La Jolla Institute for Immunology who co-authored these T cell studies, to clarify on Twitter, “We SPECULATE that it is conceivable that these T cells may potentially reduce COVID-19 disease severity. These are only speculations (no data) and because of their potential importance it is key for scientists to test these ideas, as quickly as possible. While scientists are racing as fast as possible, sophisticated research like this usually takes a lot of time and resources.”
In particular, a recent article in Nature Reviews Immunology co-authored by Crotty stated that, in the most likely epidemiological scenarios, the presence of cross-reactive T cells does not mean that fewer immune individuals are required in the population to achieve herd immunity, nor does it lead to a smaller basic reproduction number. The reproduction number, also called R, measures how many people an infected patient contaminates on average[4]. The larger the reproduction number, the more people an infected individual spreads the virus to. Therefore, the claim that cross-reactive T cells are responsible for the lower COVID-19 mortality rate is currently unsupported. According to medical practitioners, the observed diminution of death rates may be explained by some improvements in how infections are medically handled, as well as “heightened community awareness” leading to earlier detection of cases.
Conclusion
In summary, a video by Eric Berg relays several unsupported or inaccurate claims, some of which are based on flawed reasoning. The daily death rate from COVID-19 and the positivity rate are indeed lower for some countries in October 2020 compared to April 2020. However, comparing arbitrary time points instead of looking at the trend over time is misleading. A closer look at the dynamics of those metrics in October shows that cases and deaths are increasing again, akin to the trends observed in April.
While positivity rate is an important metric, it is directly affected by the testing policy. Therefore, changes in testing policy may increase or decrease the positivity rate in a manner that does not reflect the actual transmission rate in a community.
Berg’s claim that cross-reactive T cells from the common cold are responsible for the decrease in death rate between April and October 2020 is implausible, because such T cells would predate the pandemic. If they are critical to protection, as Berg states, then this protection would have been evident since the beginning of the pandemic, not several months afterwards. While recent research provides evidence that some people have T cells that can recognize proteins of SARS-CoV-2, no data is available demonstrating that these cells confer protection against COVID-19. Epidemiological models also suggest that such T cells would not alter the resistance of the population as a whole against the epidemic.
Since January 2020, the COVID-19 pandemic has swept the globe causing at least 1,200,000 registered deaths worldwide as of October 2020. Overall mortality in the U.S. increased by 300,000 deaths in 2020 compared to previous years. While the infection rate and death rate dropped in many countries after the first wave from March to April 2020, cases and deaths started increasing again in an exponential trajectory in September and October 2020, portending a second COVID-19 wave.
REFERENCES
- 1 – King et al. (2020) COVID-19—a very visible pandemic. The Lancet.
- 2 – Grifoni et al.(2020) Targets of T Cell Responses to SARS-CoV-2 Coronavirus in Humans with COVID-19 Disease and Unexposed Individuals. Cell.
- 3 – Mateus et al. (2020). Selective and cross-reactive SARS-CoV-2 T cell epitopes in unexposed humans. Science.
- 4 – Lipsitch et al. (2020) Cross-reactive memory T cells and herd immunity to SARS-CoV-2. Nature Review Immunology.
UPDATE (11 Nov. 2020):
Corrected phrasing to reflect that daily confirmed cases are overall higher in October than in April as showed in Figure 1.


