Key results
1. A study of 490 “misinformation superspreaders” (here defined as accounts that have repeatedly published popular tweets linking to known misinformation) shows that their collective popularity has significantly grown (on average, +42% interactions per tweet) since Elon Musk took effective control of the platform on 27 October 2022.
Accounts from established and credible media organizations have not benefited from a similar increase (-6% in the average number of interactions per tweet), suggesting an empowerment specific to sharers of misinformation.
2. This increase in influence is not universal: 58.2% of misinformation superspreaders have seen their average tweet gather more influence, with the remaining 41.8% seeing their average tweet’s impact decrease.
However, even among superspreaders, not all accounts are equally influential. The accounts that have grown since 27 October had on average higher engagement than those whose influence has decreased.
3. Four out of the five accounts that have gained the most influence have received replies from Elon Musk’s personal account to at least one of their top ten tweets. It is most likely that these tweets went viral because of Elon Musk’s decision to reply and bring them to the attention of his 128 million followers, pointing to a direct responsibility of Twitter’s new owner in the growth of misinformation superspreaders’ popularity.
4. These results appear to run afoul of Twitter’s commitments as a signatory of the EU Code of Practice on Disinformation, particularly those related to “take action on webpages or actors that persistently violate policies […] to limit the spread of harmful false or misleading information”, which could have regulatory consequences once the Digital Services Act comes into force in a few months.
Misinformation superspreaders on Twitter: some context
Given Elon Musk’s personal track record of making unsupported statements (for examples see here, here, and here), his takeover of Twitter has raised concerns about his plans for the platform when it came to tackling the issue of misinformation.
Since the acquisition, which was finalized on 27 October 2022, staffing choices, content moderation policy changes, the creation of a paying user tier who would receive enhanced visibility regardless of credibility, and the reinstatement of a number of previously banned accounts have been announced, further stoking doubts as to the new management’s willingness and ability to stem the flow of disinformation on the platform.
On the other hand, some of Twitter’s new initiatives have the potential to put a dent in the spread of misinformation. For instance, the worldwide rollout of Community Notes (formerly known as Bird Watch), in which contextual notes can be added to tweets provided that enough users with differing viewpoints agree on their relevance, is framed by Twitter as an innovative community-driven approach to raise information quality on the platform. Likewise, Elon Musk’s statement that Twitter’s approach would be one of “freedom of speech, not freedom of reach” (although how such a policy would translate in practice remains vague) or the commitment to make the recommendation algorithm more transparent could offer serious potential to mitigate the spread of misinformation.
On balance however, quantitative evidence so far suggests that Twitter’s new approach to ensure content quality is failing: mentions of hate speech and slurs have increased, as have climate change misinformation and the proportion of content coming from low-credibility domains.
To our knowledge, one key aspect of misinformation on Twitter before and after the acquisition has not been studied to date: whether prominent accounts that repeatedly share misinformation (dubbed “superspreaders” in misinformation studies) have seen their engagement rise, fall or remain stable since Oct. 27th.
Studying superspreaders is critical for two reasons:
1. Superspreaders account for a (very) large part of views of misinformation
Social media platforms display strong “winner-takes-all” effects, in which a handful of users account for a disproportionately large proportion of content views. Therefore, one can assume that studying what happens to misinformation superspreaders is a good approximation of what happens to misinformation in general on the platform.
2. The EU regulatory context
Whether a Musk-owned Twitter would manage to effectively tackle the spread of misinformation has become a regulatory concern for leading EU officials. With the Digital Services Act coming into force a few months away, Twitter and other large online platforms will—among numerous other obligations—have to show that they are taking appropriate measures to stem the flow of misinformation.
One way to do so is to fulfill the commitments taken on by the platform under the EU-sponsored yet self-regulatory Code of Practice on Disinformation, which Twitter signed in June 2022. Among other detailed measures, Twitter assured it would “take action against actors that persistently violate policies […] to limit the spread of harmful false or misleading information” (Measure 18.2). So far, Twitter’s performance under the Code of Practice has been lackluster: following the publication of the first set report on 9 February 2023, the European Commission singled out Twitter for failing to meet, or even report on, many of its commitments.
Should Twitter blatantly fail to rein in misinformation superspreaders, it would be in violation of its commitments under the Code of Practice and consequently, likely be in breach of the Digital Services Act. Sanctions under the Digital Services Act can go up to 6% of global platform turnover (which would run into the lower hundreds of million of dollars) and, in the case of continued non-compliance, could result in a ban of the platform in the EU.
How have misinformation superspreaders fared under Elon Musk’s Twitter ?
A. Methods
(see appendix for full details, full datasets available upon request)
To identify superspreaders, a consortium composed of fact-checking organizations Lead Stories, Bolivia Verifica, Chequea Bolivia, Mala Espina, Colombia Check, Chequeado, Newtral, and Science Feedback put together their internal databases of URLs that they had labeled as propagating misinformation in the course of their verification work.
The different geographies and languages covered by the organizations in the consortium gave us a global view, including on official languages of the EU other than English. Unsurprisingly however, the accounts garnering the most interactions posted primarily in English.
We searched Twitter for all accounts that had repeatedly shared these links, under the assumption that repeated posting of misinformation URLs was closely correlated with endorsing their message (this assumption is validated by previous research we conducted).
Lastly, we filtered these accounts to keep only those that had significant influence using the False Information Broadcaster-index, a metric which combines both frequency of misinformation sharing and influence of tweets containing misinformation URLs.
The result was a list of 514 “superspreader” users. We then analyzed all 1,450,340 tweets posted by these accounts between 1 September 2022 and 31 December 2022, a period which straddles the effective change of ownership, which occurred on 27 October.
For a control group, we collected the 641,850 tweets of the official accounts of 130 traditional media organizations which scored high on domain-level credibility in academic studies (see appendix for details).
B. Results
Superspreaders’ tweets generate more interactions after the acquisition, unlike accounts from reputable organizations
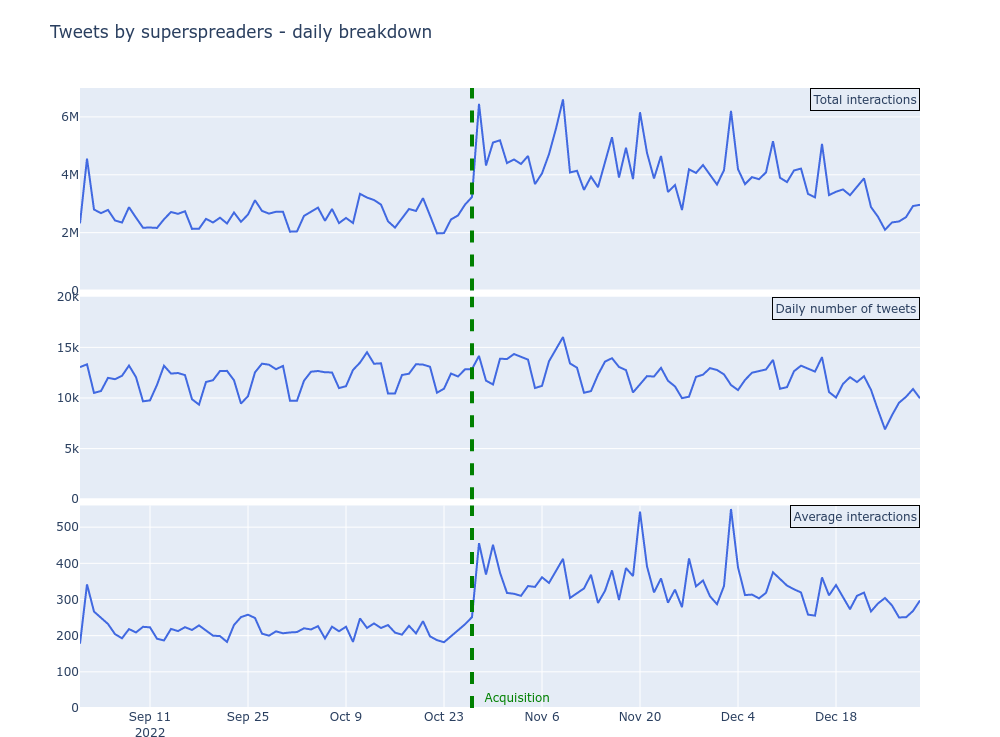
Figure 1. Daily breakdown of total interactions, number of tweets, and average interactions per tweet for all tweets posted by superspreaders between 1 Sep. 2022 and 31 Dec. 2022. On 25 September, superspreaders posted a total of 10,180 tweets, which generated 2.7 million interactions, corresponding to an average of 257.95 interactions per tweet on that day.
Immediately after the acquisition, total engagement with tweets posted by superspreaders spiked, almost doubling overnight and remaining at elevated levels ever since. Since the number of tweets from these accounts has remained roughly constant, this jump is only explained by an increase in the average engagement with these accounts’ posts.
To ensure that this increase was not due to a platform-wide phenomenon (for instance, an increase in total user numbers or in engagement per user), we contrasted this increase in engagement with that of official accounts of high-credibility organizations. We find that while superspreaders’ tweets gained on average 42.4% more interactions after the acquisition, high-credibility accounts’ tweets lost 6.3%.
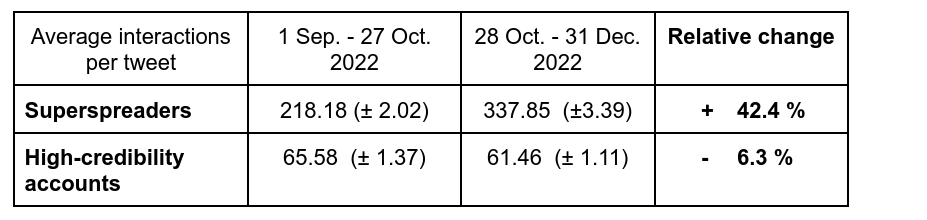
Table 1. Average change (± bootstrap standard error) in engagement per tweet by category of account, before and after the acquisition. The two cohorts are not directly comparable due to different baseline rates of engagement. Therefore, absolute engagement values are not comparable, but relative ones are.
Increase in interactions with superspreaders’ content due to large accounts gaining influence
Understanding the causes behind this average rise in superspreaders’ interactions with tweets requires an investigation into how broad-based the increase is: have all superspreader accounts benefitted, or are there only a few large ones accumulating most of the increase and therefore driving the total up?
At first glance, the rise in superspreaders’ influence is not universal: although 58.2% of superspreader accounts saw their average tweet gain influence, the remaining 41.8% saw it decrease.
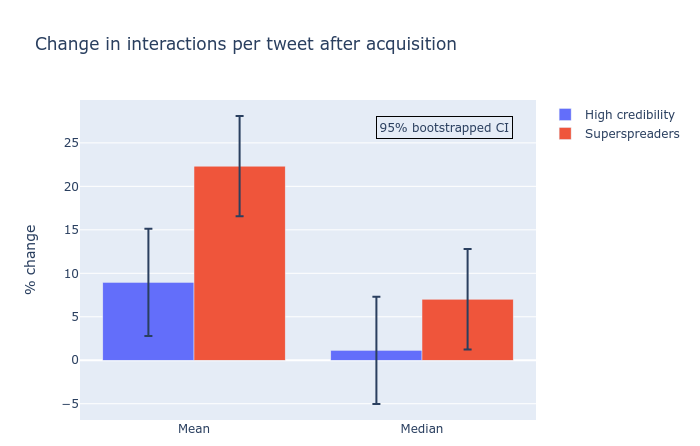
Figure 2. High-level summary statistics of change in interactions per tweet (all accounts uniformly weighted) by category, before (1 Sep – 27 Oct.) and after (28 Oct.- 31 Dec.) the acquisition. Among superspreaders, the mean gain in interactions per post in the period following the acquisition (28 Oct – 31 Dec.) was 22.3% (relative to their interactions per post over the period 1 Sep. – 27 Oct.).
These numbers further support the idea that the growth, although rather broad-based, is not universal. The mean increase across accounts (+22.3%) being lower than the overall increase in engagement with superspreaders’ post (+42.4% – see section 1) suggests that larger accounts have disproportionately benefited post-acquisition.
Plotting, for each account, the post-acquisition change in the interactions generated by their tweets against their influence (as proxied by the average number of interactions generated by their tweets pre-acquisition) further reinforces the idea that larger accounts tend to have disproportionately benefited post-Musk (9 out of the 10 highest-interactions pre-acquisition accounts have seen their average interactions per tweet increase after the acquisition).
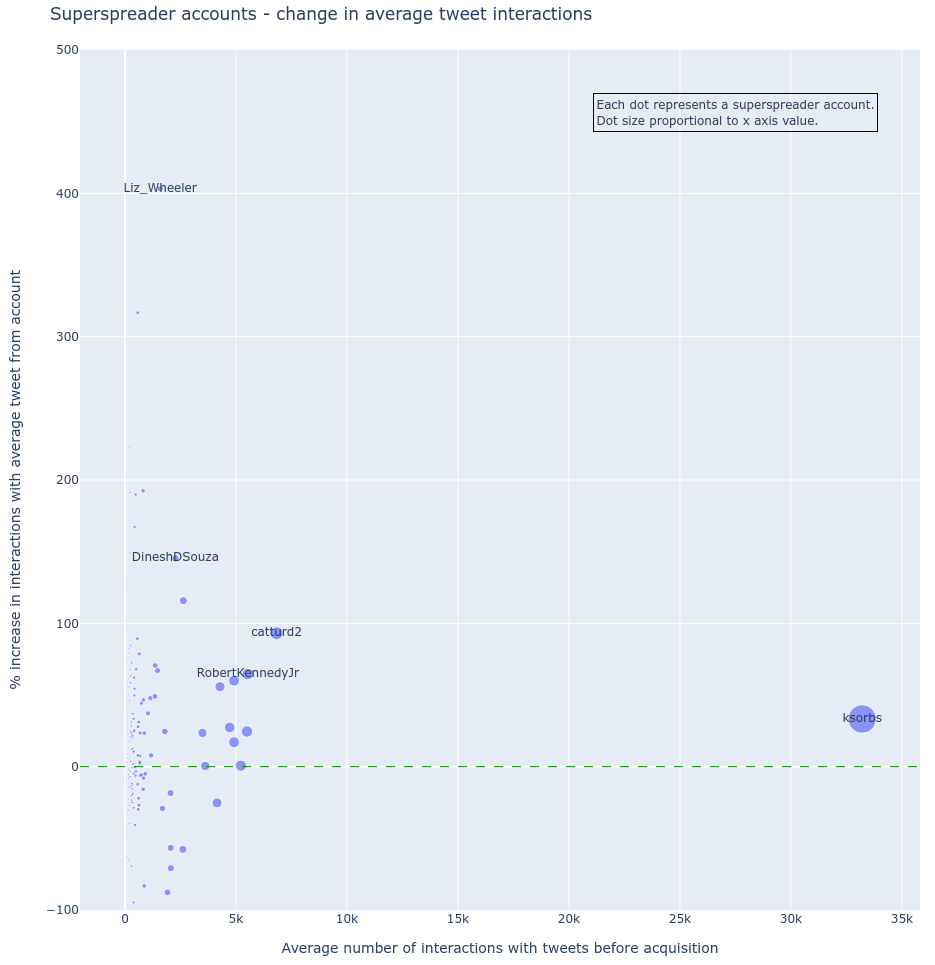
Figure 3. Relative performance of all accounts before and after the acquisition. Dot size is proportional to the average number of interactions before the acquisition (same as the x-axis).
To obtain a qualitative glimpse into what had driven the increase, we investigated the top 5 accounts that had gained the most influence (as measured by relative increase in average engagement post-acquisition multiplied by the average number of interactions per tweet pre-acquisition, so as to combine a relative growth rate and a baseline amount of influence). They are:
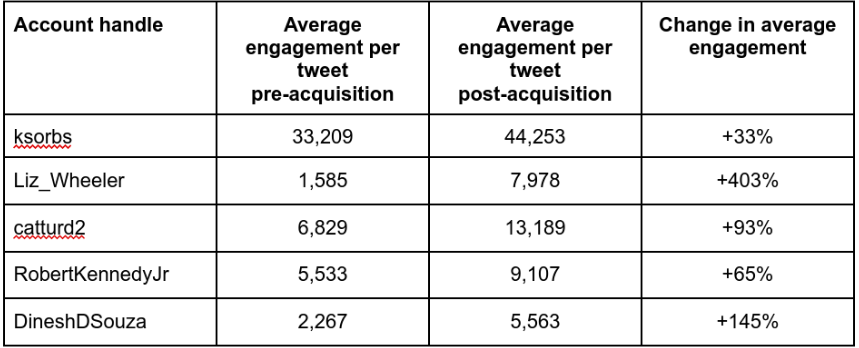
Table 2. Summary statistics of influential accounts that have grown the most since the acquisition.
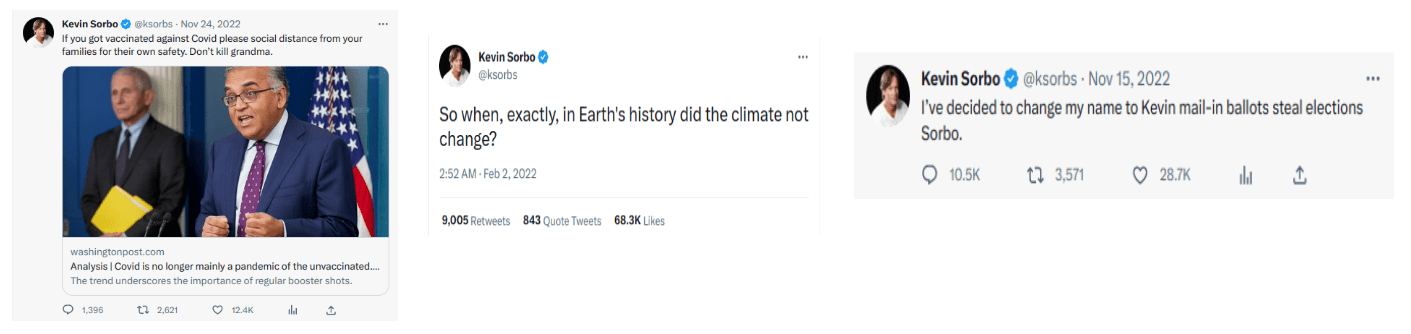
ksorbs
Account of American actor Kevin Sorbo, whose popular recent tweets include affiliated marketing posts for cell phone plans and investing in gold as well as claims that individuals vaccinated against COVID-19 pose a threat to others (false), that the results of the 2022 midterm elections were illegitimate (unsupported), and that past changes in the climate somehow undermines our understanding of current climate change (misleading).
Liz_Wheeler
Account of American political commentator Liz Wheeler, formerly a talk show host on frequently fact-checked One America News Network. She has recently propagated unsupported claims about an increase in the risk of cardiac arrest among athletes following COVID-19 vaccination (repeatedly disproved, including here and here), linked a supposed disappearance from public view of the former head of the U.S. National Institute of Allergy and Infectious Diseases (NIAID) Anthony Fauci to the existence U.S. ‘biolabs’ in Ukraine (false and unsupported respectively), and questioned the legitimacy of the 2020 U.S. presidential elections (unsupported).
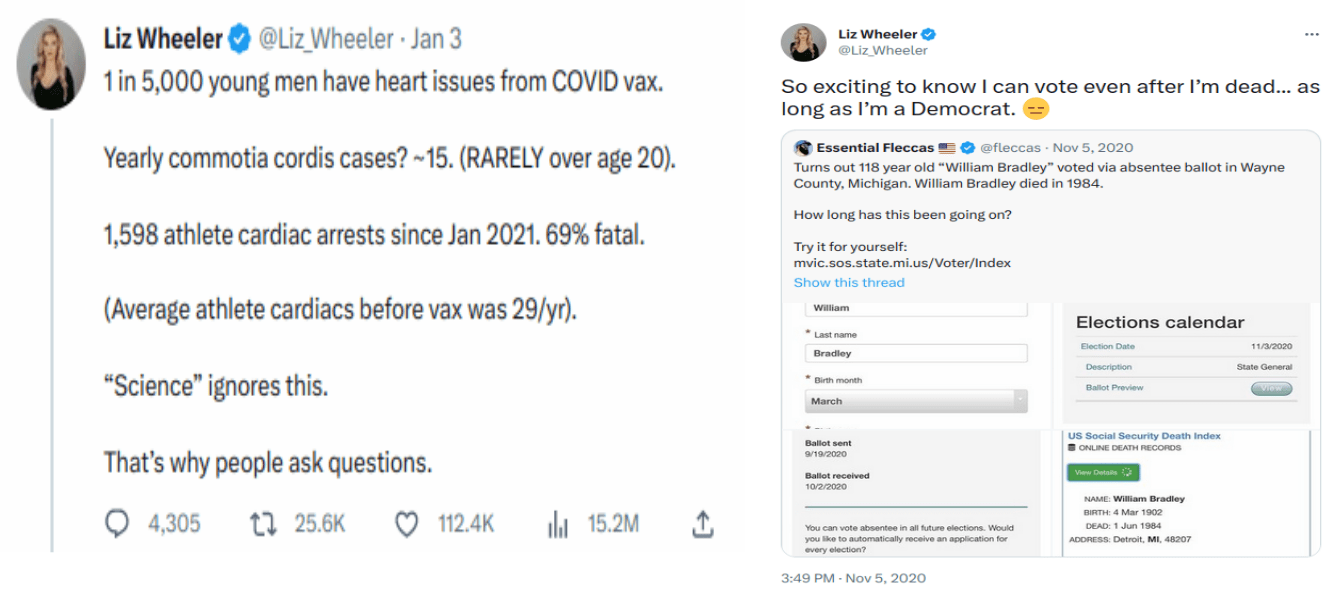
Wheeler’s spectacular spike in popularity post-acquisition can be traced back to one dominant factor: Elon Musk’s official account has repeatedly replied to her tweets, bringing them to the attention of his 128 million followers. Out of the account’s ten most popular tweets during the September-December period, five received a reply from Elon Musk’s account (1, 2, 3, 4, 5).
catturd2
A account with 1.4 million followers, whose ownership Rolling Stone traced to a Florida man in his fifties, posting commentary usually expressing dissatisfaction with established institutions using colloquial language. Much of its popularity can be traced back to its frequent interactions with former U.S. president Donald Trump.
In addition to propagating a number of misleading claims, including the usual suspects of election fraud (unsupported), the alleged ineffectiveness of face masks to limit the spread of Covid-19 (false), and of vaccines in protecting against the most dangerous effects of the disease, (false), the account has been at the center of an organized harassment campaign.
Like Liz Wheeler, its influence on the platform was boosted thanks to interactions with Elon Musk’s official account. One of his first tweets after completing the acquisition was an answer to catturd2.
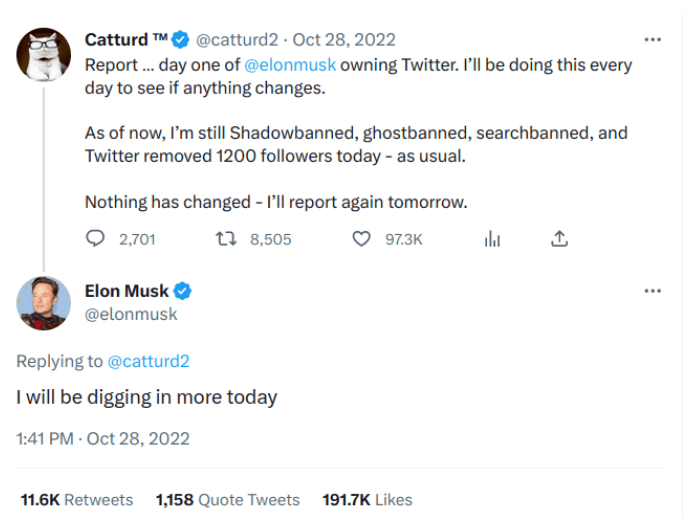
In addition, two of the account’s top ten tweets (one about a Russia-U.S. prisoner swap, the other about the Twitter Files) were replied to by Elon Musk, likely explaining their relative overperformance.
RobertKennedyJr
Robert F. Kennedy Jr. is the head of the anti-vaccination organization Children’s Health Defense, a well-known misinformation outlet whose accounts were banned by Facebook and Instagram in August 2022.
Unlike the other accounts on this list which tend to be more generic in the themes they cover, Kennedy’s account leans heavily towards health-related topics, and is particularly prolific when it comes to trumping up the supposed dangers of COVID-19 vaccines.
Like Liz_Wheeler’s and catturd2’s accounts, one of Kennedy’s top-performing tweets (accusing ‘virologists globally’ of having been bribed by Fauci with research grants) became viral after Elon Musk’s account replied to it, endorsing its content. This tweet arose as part of a conversation between Elon Musk, Kennedy Jr and self-described conservative comedians Hodge Twins, about the supposed dangerous side effects of the Pfizer COVID-19 vaccine.
DineshDSouza
Account of political commentator and filmmaker Dinesh D’Souza, who has a track record of making unsubstantiated or outright false statements. In May 2022, D’Souza released a pseudo-documentary he had produced called “2,000 Mules”, which alleged large-scale organized voter fraud in the 2020 U.S. presidential elections and was thoroughly debunked here. Despite its inaccuracies, the film received a warm welcome.
In addition to election fraud claims, the account has also supported false narratives around manipulated official COVID-19 fatalities statistics.
D’Souza’s highest-performing tweet received a reply from Elon Musk’s official account.
* * * *
With the exception of Kevin Sorbo, replies from Elon Musk’s official account feature prominently in the highest-performing tweets from the accounts that have gained the most influence since the takeover.
Why is the influence of superspreaders growing? Some hypotheses
Although a rigorous study of causality to explain the recent growth in the influence of misinformation superspreaders is beyond the scope of this research, the evidence points to two non-mutually exclusive hypotheses:
1. A Great Empowerment of the misinformation-prone community
Elon Musk’s “free speech absolutist” discourse has encouraged misinformation actors and audiences to come to the platform. His personally lending credibility to accounts with a long history of misinformation by interacting with their posts has had a noticeable impact on the overall popularity of some superspreaders by bringing them to the attention of his 128 million followers.
2. The weakening of Twitter’s moderation policy and resources is gradually making its effects felt
The dismantling of moderation teams, the scrapping of moderation rules related to COVID-19, and the increase in visibility of unvetted Twitter Blue accounts would all be expected to contribute to a progressive increase in the prevalence of low-credibility content on the platform.
Specifically, since Twitter’s pre-Musk moderation actions centered around reducing reach rather than removing content, we’d expect to observe a relative increase post-Musk in the number of low-quality posts (since they were very seldom banned), but an increase in the influence of these posts (as little to no downranking action is taken) resulting from a removal of these moderation actions. This hypothesis is further supported by data from the University of Michigan’s Iffy Quotient, which measures the proportion of posts containing links to low-credibility domains among the most influential posts of the platform.
The figure below illustrates this exact phenomenon at play: on 27 Oct., 12.4% of the 5,000 most popular news articles shared on Twitter came from low-credibility websites. By 4 Feb. (this study’s time of writing), the proportion had risen to 15.9% (a 3.5 percentage point increase). Over the same period, engagement with these articles had risen from 10.9% to 25.3% (a 14.4 percentage point increase) of interactions with these 5,000 news articles. In other words, the relative proportion of low-credibility URLs grew slowly, but engagement with them soared.
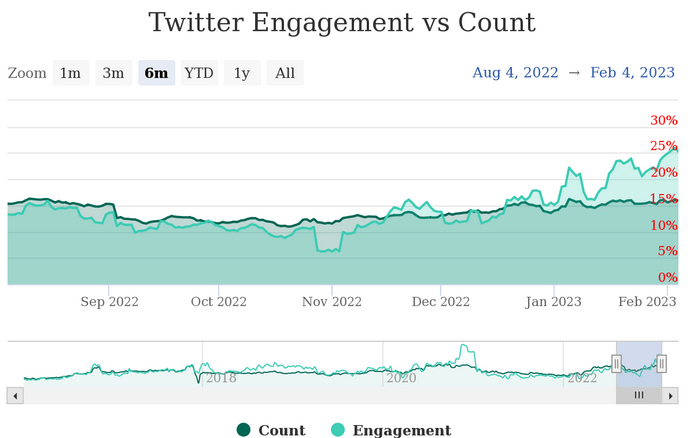
Figure 4. Twitter’s Iffy Quotient over the past 6 months : proportion of news articles trending on Twitter that come from low-credibility websites (unweighted and engagement-weighted). Source: The University of Michigan’s School of Information Center for Social Media Responsibility.
Appendix – Detailed Methodology
1. Collecting URLs that contain misinformation
We collected a dataset of URLs flagged as containing misinformation by fact-checkers from Lead Stories, Bolivia Verifica, Mala Espina, Colombia Check, Chequeado and Newtral, as well as from Open Feedback, a Science Feedback project building a database of fact checked content.
The resulting dataset consisted in 12,946 unique URLs marked as containing a claim that professional fact-checkers had rated as factually false or misleading.
These URLs point to articles from low-credibility news websites, to posts on other social media platforms or to posts on Twitter itself.
2. Identifying tweets containing these URLs
We then collected data on the spread of these URLs on Twitter. While some did not appear at all on the platform, others had been shared thousands of times (the most shared misinformation URL in our dataset, which pointed to a Pfizer document on reported vaccine side effects and was widely and mistakenly shared as ‘proof’ of the dangers of Covid-19 vaccine dangers and was debunked here, appeared in over 15,000 tweets).
The underlying assumption was that sharing a link to a proven misinformation URL was a strong predictor of the account endorsing the message in the misinformation URL. This approach is validated by our findings in a previous study using the same methodology, in which we found that the tweet indeed supported the claim made in the misinformation URL in over 90% of cases).
3. Identifying influential accounts repeatedly sharing misinformation URLs
We then consolidated this tweets data at the account level, resulting, for each account, in:
- a number of distinct misinformation URLs shared,
- a number of tweets containing these misinformation URLs,
- a number of interactions (quotes, retweets, likes or replies) generated by these tweets,
- the dominant language in which the account tweets,
- The “verified” status of the user (this “verified” status refers to the legacy verified status, which was granted to official accounts of prominent individuals or organizations, and not to the new Twitter Blue, which can be obtained by any user for a USD 8 monthly fee).
Following a methodology developed by DeVerna et al.[1], we computed a FIB-index for each account. The FIB (False Information Broadcaster)-Index is a metric inspired by the h-index widely used in academia to measure the influence of a researcher. A FIB-index of 10 means that the user has published at least 10 tweets containing a misinformation URL, and that each of these 10 tweets has generated at least 10 interactions.
We selected users with FIB-indices of at least 15, allowing us to only keep accounts that mixed significant influence and repeated sharing of misinformation URLs, thereby limiting the risk of including false positives in our sample of misinformation superspreaders. For reference, the highest FIB-index in our dataset was 135.
From this list, we filtered out the official accounts of two usually reliable media outlets, as defined by Lin et al.[2]): The Telegraph, Sky News and CNN.
The resulting list contained 514 influential accounts that had repeatedly spread misinformation.
4. Devising a control group of high-credibility accounts
In order to isolate any effect specific to influential spreaders of misinformation on the platform, we used a control group of prominent, high-credibility accounts coming from two sources :
This allowed us to avoid being misled by potential platform-wide effects, such as a change in overall user activity on Twitter (which would presumably drive interactions with it regardless of platform decisions).
Given that the most represented European languages in our sample of tweets containing misinformation URLs were English, Spanish and French, we collected a list of 135 high-credibility accounts publishing primarily in one of these three languages (84 in English, 27 in French and 23 in Spanish).
The list of high-credibility accounts was obtained either from the official Twitter accounts of domain names ranked highly across a number of dimensions[2], or from using Twitter’s “You Might Like” suggested recommendations, when accessed from the account of a highly-trusted organization.
5. Collecting all tweets published by low-credibility and high-credibility accounts between 1 Sep. and 31 Dec. 2022.
We collected all tweets published by accounts in both low- and high-credibility lists between 1 Sep. and 31 Dec. 2022, a period straddling the change of ownership that took place on 27 Oct. 2022.
Out of the 514 misinformation superspreaders, 490 had tweeted during the study period. The most represented languages were as follows: 329 accounts tweeted primarily in English, 32 in Japanese, 26 in French, and 16 in Spanish.
6. Ruling out the “Verified” status of an account as a potential explanation for the result
We investigated whether an account’s “Verified” status had an impact on its popularity trajectory before and after the acquisition. We did not find a substantial difference between the growth of verified and unverified superspreader accounts.
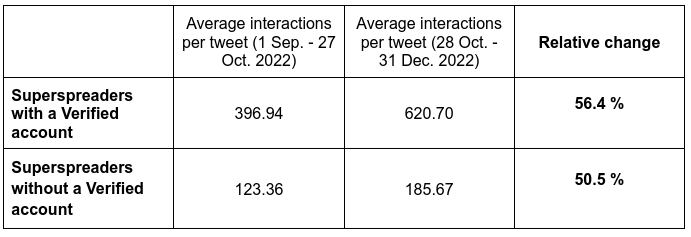
Table 3. Average increase/decrease in engagement per tweet by “Verified” status of account, before and after the acquisition. The two cohorts are not directly comparable due to different baseline rates of engagement. Therefore, absolute engagement values are not comparable, but relative ones are.
“Verified” in this context refers to accounts that were verified under Twitter’s former system (which ensured the legitimacy of the accounts claiming to belong to prominent public figures or organizations), and not those which pay for Twitter Blue (a subscription service which gives inter alia a visibility boost to the account’s posts in threads). This choice was made due to methodological constraints (Twitter Blue was rolled out, then canceled, then rolled out again during the study window so isolating its effect would be challenging).
7. Figure-specific processing
7.1. Figure 1
Divide all tweets into two categories: tweets published by one of the 490 misinformation superspreader accounts and tweets published by one of the 135 high-credibility accounts.
For each category, compute and plot daily statistics on:
a. total number of tweets posted by any of the account,
b. total number of interactions generated by any of these tweets,
c. average number of interactions generated by tweets on that day (simple division of b by a).
7.2. Table 1
Divide all tweets into two categories: tweets published by one of the 490 misinformation superspreader accounts and tweets published by one of the 135 high-credibility accounts.
Further divide both categories into two subcategories: tweets published between Sept. 1st and Oct. 27th 2022 (inclusive), and tweets published between 28 Oct. and 31 Dec. 2022.
Compute average interactions per tweet for each subcategory, as well as the percentage increase for each category.
Standard Error is obtained via a 95% confidence-level bootstrap (100 resamples) using the scipy Python package’s stats.bootstrap method.
7.3. Figure 2
For each account, compute the average number of interactions per tweet for the period 1 Sep. – 27 Oct. 2022 (inclusive), and for the period 28 Oct. – 31 Dec. 2022.
For each account, compute the relative change in average interactions per tweet before and after Oct. 27th. If account X garnered on average 30 interactions per tweet before Oct. 27th and 40 interactions per tweet after 27 Oct. 27th, its relative change is (40-30)/30 = 33.3 %.
Compute mean and median change across accounts (all accounts equally weighted) for each category (misinformation superspreaders and high-credibility accounts).
Standard Error is obtained via a 95% confidence-level bootstrap (9,999 resamples) using the scipy Python package’s stats.bootstrap method.
7.4. Figure 3
Using the same account-level data as above (relative change in interactions per tweet before and after 27 Oct.), display a scatterplot of the data showing the relationship between the average engagement before the acquisition (a proxy for how influential the account was before the acquisition) and the change in average engagement after the acquisition (a proxy for how much the account grew since the acquisition).
The size of the dots is relative to their x-axis value (average engagement before the acquisition), so as to convey a visual sense of how much each account impacts the overall results. The 5 labeled dots correspond to the 5 accounts listed in table 2 (see below).
7.5. Table 2
For each misinformation superspreader account, multiply the average engagement per tweet before the acquisition by the percentage change in interactions per tweet after the engagement. This results in a single metric combining pre-acquisition influence with post-acquisition growth, which we use as a proxy to identify the largest accounts that gained the most influence since the acquisition.
The five accounts with the highest score were isolated.
REFERENCES
- 1 – DeVerna et al. (2022) Identification and characterization of misinformation superspreaders on social media. arXiv. [Note: This is a preprint that has not yet been peer-reviewed at the time of this article’s publication]
- 2 – Lin et al. (2022) High level of agreement across different news domain quality ratings. PsyarXiv. [Note: This is a preprint that has not yet been peer-reviewed at the time of this article’s publication]