Introduction
As social media platforms try to tackle the spread of misinformation, their first challenge is the reliable identification of which content breaches their misinformation policy. Like everything in the social media space, this has to be done at a very large scale if it is to have any meaningful impact.
Once identified, such content can be removed—if it presents imminent harm—have its visibility lowered or carry a notice signaling to users that the post should be treated with caution.
While it is useful, flagging individual pieces of content one by one is not the be-all end-all strategy against misinformation. A perfect automated system to screen all misinformation content before it gets published remains out of reach, as even the most advanced tools lack reliability (resulting in either over- or under-moderation). On the other hand, given the volume of content posted on social media, human moderators will never be able to reach the throughput necessary to put a dent in the flow of misinformation.
A method to scale up how platforms detect misinformation without compromising reliability is therefore needed. One of the solutions put forward by some platforms, such as Facebook or Twitter, is to use flags on individual posts as input for broader moderation action at the account or group level, in order to act as a deterrent against repeated sharing of misinformation, or to better inform their users.
However, for such a preventive strategy to be effective, users need to know that they won’t get away with repeated sharing of misinformation. This requires enough reliable fact-checks to be conducted so that users feel there is a non-negligible chance they will be held accountable for posting misinformation, and therefore think twice before publishing.
So, given the scale mismatch between the volume of misinformation posted on social media and that of fact-checked content, is there a way to sufficiently leverage fact-checking efforts on individual URLs to gain broader insights, for instance to detect which accounts repeatedly share unreliable content or where influential misinformation comes from?
We set out to see what we could find based on the data that was available to us. For a library of fact-checked content, we used the Open Feedback database. To see how it could help identify misinformation and where it originates from, we looked at Twitter data but because of the unmatched scope of their open data policy.
The data we’re working with
The Open Feedback database mostly contains claims checked as misinformation on scientific topics, predominantly on the subjects of climate change and health. As of 21 February 2022, it contained 12,615 unique URLs which have been reviewed by at least one International Fact-Checking Network signatory.
These URLs can link to anything, such as a news article, a video on YouTube, a Facebook post or a tweet. Some URLs link to credible content, but the majority of URLs in the Open Feedback database contain inaccurate or misleading information. Given that we’re studying misinformation, we only focused on the latter ones.
Using this list of URLs as input, we set out to see how they were being shared on Twitter.
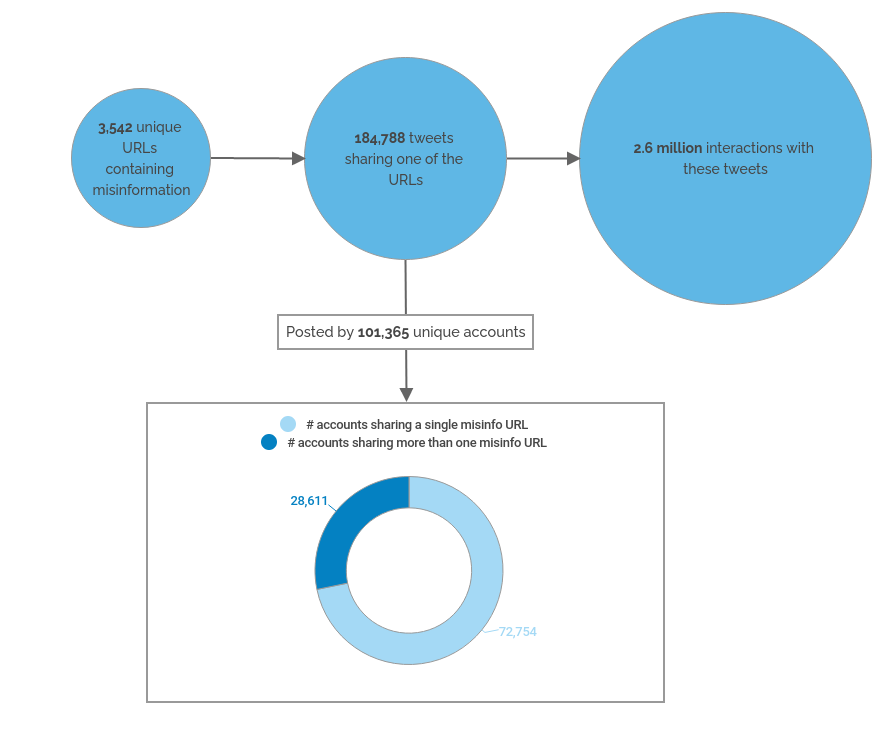
We looked for any tweet posted between 1 September 2021 and 21 February 2022 which shared any of these URLs. This window of time was selected in order to ensure that our analysis is relevant to current times. Out of the 12,615 URLs, we found that only 3,542 URLs containing misinformation had been shared in a tweet at least once. The remaining 9,073 were either not posted on Twitter in this time range, don’t contain misinformation or have been deleted or otherwise made inaccessible by Twitter.

Figure 1. High-level overview of the sample of tweets in our study
Note that these numbers are only based on the URLs available in the Open Feedback database and only refer to tweets published between September 2021 and February 2022. If we instead had a full list of all URLs reviewed by all fact-checking organizations and an expanded time window, the results of this study would become more relevant and exhaustive.
The primary metric used in our analysis is the number of interactions (number of retweets + number of replies + number of likes), which we use as a proxy for the influence of content and accounts. To provide a sense of scale, we will express the number of interactions as a percentage of the interactions with all the tweets sharing a misinformation URL in our sample.
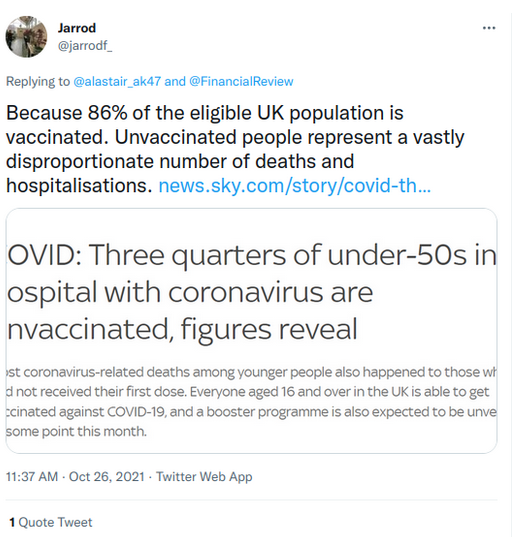
There is an important caveat to note regarding our analysis. In some rare cases, a tweet might share a misinformation URL while disagreeing with it, for instance in this case:

Figure 2. Example of a tweet debunking a misleading claim
Although the tweet is unambiguously a debunk of the misleading claim made in the URL, it nonetheless formed part of our sample as the tweet contained the URL. Despite such examples, we decided to include all tweets containing a misinformation URL as part of our sample, as our database lacked information as to whether or not a given tweet supports or debunks the claim made in the content it links to.
This decision was supported by a human inspection of 295 randomly-selected tweets from our sample. We found that 208 (70.5%) of the tweets actively supported the misleading claim made in the URL, 67 (22.7%) shared it without any comment (considered to be implicitly endorsing it and spreading misinformation), and only 6 (2.0%) opposed it. A further 13 (4.4%) were ambiguous, meaning that the tweet’s text was unrelated to the content of the URL shared or was written in a language we did not understand, including with the use of online translating tools. In other words, tweets that share a URL are by far and large intended to spread the inaccurate or misleading claim(s) contained in the URL; only a small minority debunk the claim(s).
Furthermore, since debunks are rare to begin with, their effect tends to disappear when results are aggregated, for instance by account, by URL or domain name. All told, we don’t expect this potential confounding factor from debunks to materially affect our conclusions.
Results
Now that the stage is set, what did we find?
1. Sharing misinformation often does not correlate with high engagement
We first checked to see whether accounts that posted the highest number of misinformation tweets (hyperactive accounts) had a lot of influence, using as a proxy the total number of interactions generated by their tweets containing a misinformation URL.
The answer is no. The top 100 most active accounts (0.1% of all accounts in the sample) accounted for only 1.1% of the interactions in our sample.
For instance, the award for “the most active poster of misinformation links” goes to an account that published 227 tweets containing a flagged URL over the 6 six months covered in our study; this represents more than one misinformation tweet per day. However, this account has only 112 followers. Keep in mind that this number only includes the flagged URLs that are present in the Open Feedback database, so the user most likely posted many more misinformation tweets.
Key takeaway:
Frequency of posting misinformation doesn’t equate to influence, as such, focusing solely on hyperactive accounts, without considering other factors (e.g. number of followers), doesn’t appear to be a particularly efficient approach.
2. A few key accounts have an outsized impact
Ranking the accounts by number of interactions generated by their posts paints a picture of concentration: the top 100 accounts (0.1% of all accounts in the sample) made up 44.1% of interactions with tweets sharing misinformation in our sample.
This is consistent with previous reports on online misinformation, such as the Center for Countering Digital Hate’s Disinformation Dozen, which found that just a dozen individuals are responsible for a large fraction of health misinformation circulating on social media.
Key takeaway:
Only a handful of users, specifically those with high follower counts, account for the greatest share of user engagement with misinformation.
3. A more refined look at accounts: mixing impact and frequency
Simply knowing that some accounts generate most engagement with misinformation isn’t sufficiently actionable to be helpful. For example, some users in our sample had shared only one misinformation URL, but because they have a very large following their single misinformation tweet generated significant engagement.
Priming such accounts for enhanced scrutiny wouldn’t necessarily be either effective or fair: their tweet might be the result of an honest mistake or a debunk of a false claim, which, as explained above, would still show up in our database.
What could constitute more interesting prime targets for enhanced scrutiny are accounts that have shared several different misinformation links — indicating high likelihood that they will post more in the future — and that have generated high interactions. In other words, this is an approach that will account for both frequency and impact.
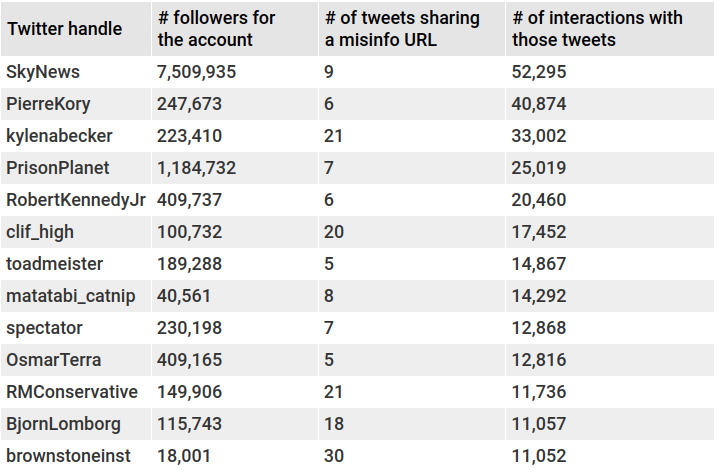
Setting the bar at a minimum of five tweets sharing a misinformation URL, which equates to about an average of one or more URL a month over our study’s time window, and then ranking the accounts by total number of interactions gives us a list of high-impact accounts that have repeatedly posted URLs sharing misinformation: the leading 100 accounts represent 19.5% of all interactions in our sample.
Below are the top 20:
Figure 3. Table of 20 large misinformation-spreading Twitter accounts in our sample. For example, between 1 September 2021 and 21 February 2022, user toadmeister posted five tweets containing a link to URL containing misinformation. Those tweets generated 14,867 interactions (likes + retweets + replies) from Twitter users, single-handedly accounting for 0.6% of all the interactions in our sample of all tweets that contain a misinformation link.
Key takeaway:
If a social media platform seeks to maximize the resource-effectiveness of its misinformation moderation efforts, studying accounts displaying both high frequency of misinformation posts and high engagement would be a good starting point.
4. At the URL level: which specific URLs generate the most interactions?
We took a look at the misinformation URLs that had generated the most interactions. Here are the top 20:
Figure 4. Table of the 20 URLs that received the most engagement on Twitter. For example, between 1 September 2021 and 21 February 2022, the URL from the brownstone.org website was posted in 4,009 tweets. Those tweets generated 98,838 interactions (likes + retweets + replies) from Twitter users, accounting for 3.8% of all the interactions in our sample.
This table presents a very interesting mixed bag of three categories:
- Some URLs point to sources that are known for regularly publishing misinformation, such as the thegatewaypundit.com website;
- Many point to posts on social media platforms, such as Twitter itself (i.e. tweets linking to other tweets that contain misinformation), Spotify, and Substack;
- Some sources that are generally reliable news outlets, such as Reuters, Rolling Stone or Il Tempo.
While categories 1 and 2 were expected, category 3 warranted a specific investigation.
The example of the Reuters story (the third URL in the table) is representative of this last group: the URL linked to a report about a study by Kowa, a Japanese pharmaceutical company, on the efficacy of the drug Ivermectin against some SARS-CoV-2 variants. In the original story, the article mistakenly reported that the company had claimed that Ivermectin was “effective” against Omicron in human trials. This was a misrepresentation of the company’s actual statement, which only claimed an “antiviral effect” had been observed in non-clinical studies, i.e. not in humans.
Following good journalistic practice, Reuters corrected the story. Incidentally, one of the hallmarks of a credible source is openly issuing corrections when the source is made aware of the mistake; unreliable outlets on the other hand tend to avoid admitting they published wrong information or quietly remove the misinformation without informing readers of the removal.
However, the correction came too late in the sense that it had already been shared widely by those thinking that Ivermectin was an effective cure. Of course, Reuters’ usual reliability lent credence to that claim.
Key takeaway:
When looked at from a single-URL perspective, we observe a mix of different origins for problematic content: platforms, unreliable and reliable websites. Furthermore, high-credibility sources’ wide reach and reputation implies great responsibility! Any factual mistake they make will be widely shared and amplified.
5. Grouping multiple URLs by claim : which misinformation narratives attracted the most interactions ?
The Open Feedback database associates a “claim” to most of the URLs reviewed. A claim is usually a one-sentence summary of the narrative that a piece of content conveys such as ‘Spike protein generated from COVID-19 vaccination accumulate in the ovaries’ (it’s false) or ‘There is no climate emergency; ecosystems are thriving and humanity is benefiting from increased carbon dioxide’ (also false).
Claims are interesting in that they allow us to group together different URLs that are sharing the same (mis)information. Although they are not as unique or as unambiguous as URLs and so are harder to track at scale, we were interested in taking a quick peek at which claims had generated the most engagement on Twitter over our time window:
Figure 5. Table of 20 misinformation claims which generated the most interactions. Between 1 September 2021 and 21 February 2022, URLs pointing to pages claiming that the Biden administration was spending $30 million on crack pipes were shared in 1,277 tweets. Those tweets generated 78,356 interactions (likes + retweets + replies) from Twitter users, accounting for 3.03% of all the interactions in our sample.
6. Influential misinformation comes from very few domains
The URL level, although interesting to assess which specific pieces of content garner the most influence, lacks actionability for two reasons:
- Human moderators can’t review every URL posted, so many will fall through the cracks;
- By the time a URL gets flagged and reviewed, it might already be past its peak virality, so moderation wouldn’t be of much use.
Our sample contained misinformation URLs originating from 964 different domains. We filtered out domains belonging to social media platforms such as Facebook, YouTube, and Twitter itself. Because their content is user-generated, they’re not editorially controlled and warrant their own approach. This left only websites publishing their own content.
Just 20 of those domains were responsible for 54.0% of all interactions with misinformation in our sample excluding platforms. The top 100 accounted for 86.3%. Classic Pareto at work!
Figure 6. Table of 20 domains whose links containing misinformation generated the most interactions. For example, between 1 September 2021 and 21 February 2022, URLs leading to 7 different pages that contain misinformation and are hosted on the sky.com domain were posted in 1,636 tweets. Those tweets generated 147,983 interactions (likes + retweets + replies) from Twitter users, accounting for 8.0% of all the interactions in our sample.
Key takeaway:
If platforms aim to maximize their ability to detect misinformation, focusing on influential domain names that frequently share misinformation can be an effective way to do so.
Conclusion
Following the trail of URLs containing misinformation is a useful method to leverage the work of human fact-checkers: a review of the content of one single URL can then be used to identify dozens or hundreds of posts sharing that piece of misinformation.
In turn, these individual posts can be aggregated to shortlist key candidates for enhanced moderation scrutiny. Using Twitter as an example, we found that we could devise a fact-based methodology to reliably identify accounts that had both outsized influence and a history of posting misinformation.
Likewise, influential mis- and disinformation seems to be mainly originating from just a handful of domains. A social media platform wanting to tackle misinformation seriously could maintain a list of such sites and ensure they are not weaponized to propagate misinformation. The platform could, for instance, add warning labels on posts sharing URLs from these sites, limit the number of shares of their content by a single user or ensure the recommendation algorithm does not boost their visibility.
These proposed methods are of course only examples, which would need to be adapted to each social media platform’s definition of misinformation and the extent to which it tolerates misinformation on the platform.
Nevertheless, our work validates the general idea that, starting from a relatively low number of fact-checked items (a few thousands were used for this study), effective systems can be designed to reliably and objectively identify prime sources of misinformation.
