
FULL CLAIM: COVID-19 vaccination is associated with an increase of mortality ; “The more doses on average you have in a region within the United States, the bigger increase in mortality that region has had in 2022 when compared to 2021” ; “hundreds of millions of us had our friends and family and all of society having to deal with these long-term health consequences”
REVIEW
In spite of pre-authorization clinical trials and post-marketing studies showing that COVID-19 vaccines’ benefits largely outweigh their possible risks, claims questioning their safety continue to persist. Health Feedback already showed their inaccuracy on multiple occasions.
One example of such claims is that the administration of vaccine doses in the U.S. was associated with an increase of all-cause mortality. This claim was made by insurance analyst Josh Stirling during a live streaming in December 2022 organized by the Vaccine Safety Research Foundation, which is opposed to vaccination and is led by entrepreneur Steve Kirsch, who has made multiple inaccurate and misleading claims about COVID-19 vaccine safety.
Stirling later repeated his claim in an interview for the Epoch Times in January 2023 and some excerpts of that interview later circulated on social media.
During the livestream, Stirling correlated the change in mortality from 2021 to 2022 with the number of administered COVID-19 vaccine doses across U.S. metro areas. Observing a positive correlation between the two variables, meaning that the increase in all-cause mortality was higher in metro areas with a higher number of distributed doses, Stirling concluded that this meant each additional vaccine dose increased mortality by 7%. Health Feedback reached out to the author for comment and will update this review if new information becomes available.
But as we will explain below, Stirling’s analysis is misleading as the data it uses cannot provide meaningful conclusions on vaccine safety.
To begin with, the claim is flawed because correlation alone isn’t evidence of causality. The fact that two variables—such as the mortality increase and the number of vaccine doses—vary in the same manner is indeed one of the elements that could suggest a causal association. But it’s far from being sufficient. Many independent variables can appear to be correlated either by chance or because they are both affected by an unknown factor called a confounding factor. Therefore, additional steps need to be taken to demonstrate causality, which Stirling failed to present.
Second, Stirling didn’t take into consideration the possible bias when comparing different areas. Indeed, regions of the U.S. vary by many factors: average age of the population, population density, access to healthcare, average income per capita. All these factors can impact how likely a person is to get vaccinated and how likely they are to die. Therefore, one would need to account for these differences before comparing all those metro areas.
Third, Stirling’s analysis was done at the population level, since he compared the mortality increase from 2021 to 2022 to the number of doses administered per metro area. This data provides no information about the vaccination status of the people who died, meaning that we cannot tell whether the increased mortality is occurring mostly in the vaccinated or the unvaccinated population. Inferring conclusions at the individual level from data obtained at the population level is known as the ecological fallacy and has been a recurrent logical fallacy in many vaccine-related claims, as Health Feedback explained on previous occasions.
Last, Stirling’s analysis involved examining the variation of mortality between 2021 and 2022, but this introduces a significant but more subtle limitation to the analysis, which we’ll explain below.
Relative metrics such as the mortality variation from one year to the next can be useful but lack information on one important aspect, which is the absolute all-cause mortality level in each metro area.
For instance, a state suffering from an exceptionally high mortality rate but with slightly fewer people dying in 2022 compared to 2021 will be registered as a decrease in mortality. Conversely, a state with a much lower mortality rate but where slightly more people died in 2022 than in 2021 will be registered as an increase in mortality. In reality, however, the latter state is faring much better than the former. Only showing the relative change in mortality rate, as Stirling did, failed to address this possibility.
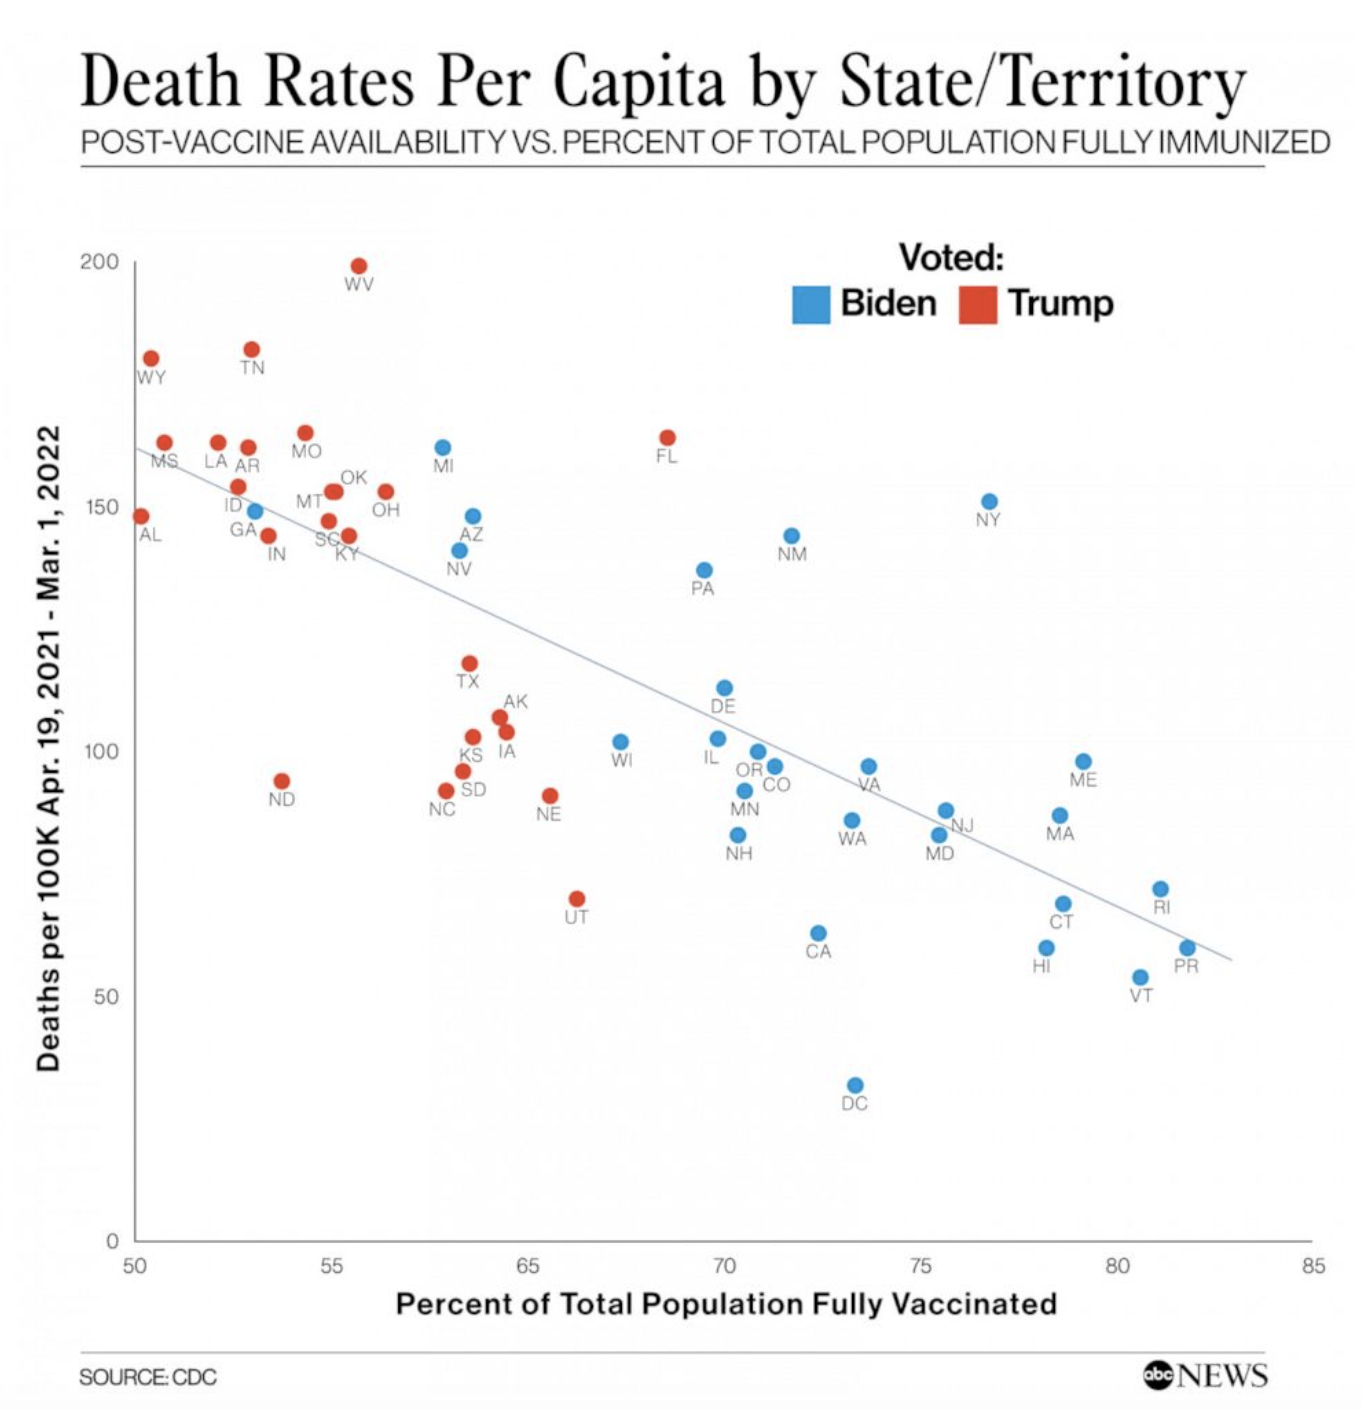
An analysis by ABC News did just that. They compared the absolute mortality (not the variation) with the vaccination coverage for each state for the period between April 2021 to March 2022 period and found that states with lower vaccination coverage tend to experience a higher mortality rate, contradicting Stirling’s conclusions (Figure 1).

Figure 1. Correlating death rates per 100,000 people by U.S. state/territory between April 2021 and March 2022 with the proportion of fully vaccinated people in the state. States with a higher percentage of fully vaccinated individuals experienced less deaths. Source: ABC Network.
In summary, Stirling’s analysis of mortality data contains several biases, such as the comparison of demographically and economically different areas and the lack of information on the vaccination status of individuals. Furthermore, only relying on relative metrics such as the variation of mortality rates can be misleading as it doesn’t include information about the actual death toll of each area. Correlating the vaccine coverage of states with their mortality rate actually shows that high vaccination coverage isn’t associated with increased mortality.


