Inadequate support: It takes at least four weeks to reach an accurate report of the number of COVID-19-related deaths during a given week. At the time the posts were published, the data used to support the claim were taken from the NCHS dataset during the lag time between when the deaths occurred and when they were reported, and are therefore incomplete.

FULL CLAIM: Deaths from COVID-19 are nearing zero in the U.S.
REVIEW
Numerous Facebook posts published in early July 2020 claimed that the number of deaths from COVID-19 in the U.S. was “nearing zero”. Such claims contain a grain of truth, given that we can observe a downward trend in the weekly COVID-19 death counts since its peak in April 2020. However, these claims are misleading as they are based on incomplete death counts that are bound to increase over time due to the significant lag time between when deaths occur and when they are reported to the federal government. Data from other sources also contradicts these claims as they report higher and increasing numbers of deaths in the first days of July 2020.
The post is based on the weekly release of COVID-19-related deaths by the National Center for Health Statistics (NCHS), part of the U.S. Centers for Disease Control and Prevention (CDC). The latest death count shown in the post is for the week ending on 4 July 2020, indicating that it comes from the release of data for week 27. In the post, the death count listed for week 27 is 71, which was preceded by several weeks of a downward trend in deaths starting during the week ending 18 April 2020.
However, as the NCHS explains and as Health Feedback previously discussed, the initial report of death counts from the NCHS are underestimates due to the reporting lag. Indeed, it can take several weeks for the NCHS to collect and process death certificates from every state. As a result, death counts for the recent weeks tend to increase over the course of the subsequent releases from the NCHS. The NCHS stipulates that it takes one to eight weeks for death certificates to be received and counted. The NCHS also warns that its death counts usually lag one to two weeks behind data from other sources.
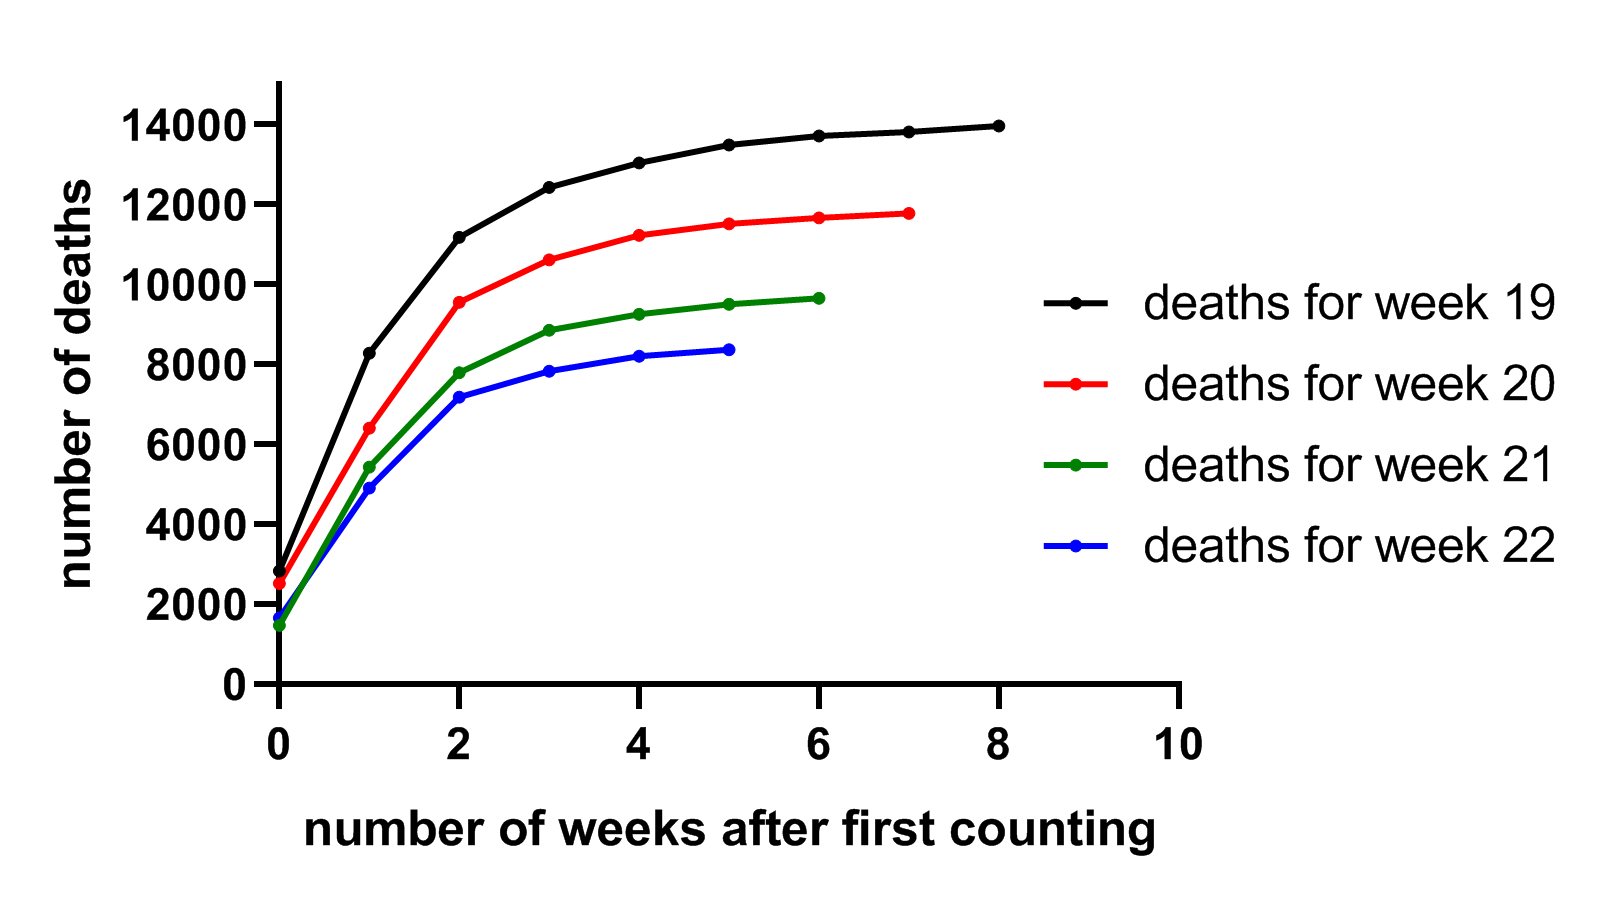
To illustrate this point, we looked at deaths due to pneumonia, influenza, and COVID-19 (PIC) for the four weeks of May 2020, as indicated in all the NCHS releases in May, June, and early July 2020 (Figure 1). Each curve indicates the number of PIC deaths for a given week as initially reported by the NHCS (0 on the x-axis) and in the subsequent releases from the NHCS. For example, the blue curve indicates the number of PIC deaths that occurred during week 22, as reported in the NCHS releases during weeks 22 (0 on the x-axis), 23, 24, 25, 26, and 27. The graph clearly shows that the death count for a given week increases with subsequent releases of data, as more death certificates are processed and the initial underreporting is progressively corrected.

Corrections to the death counts are largest in the first two weeks following the initial release of data, then become smaller over time until they stabilize around four weeks. This means that it is necessary to wait at least four weeks in order to have an accurate estimate of the number of COVID-19 deaths in a given week. For example, if the current date is 11 July 2020 (week 28), then we should only rely on data up to week 24, which ends on 13 June. As explained above, the number of deaths will likely increase again with subsequent data releases, but as shown in Figure 1, the changes are small after around four weeks.
Due to this reporting lag, it is misleading to draw conclusions about the dynamics of COVID-19 deaths on 8 July using the death counts of the preceding week (ending 4 July 2020). Although the number of deaths indeed decreased from 18 April to 4 July, it is not possible to claim that it is “nearing zero”, given that definitive data to support that claim are unavailable.
In the context of incomplete datasets, a good approach is to look at other sources of information to see if they display similar trends. While each dataset taken individually may have its own biases, if multiple sources all indicate that the number of COVID-19 deaths in July 2020 is declining, the observation is much more likely to be genuine rather than a result of bias and methodological shortcomings.
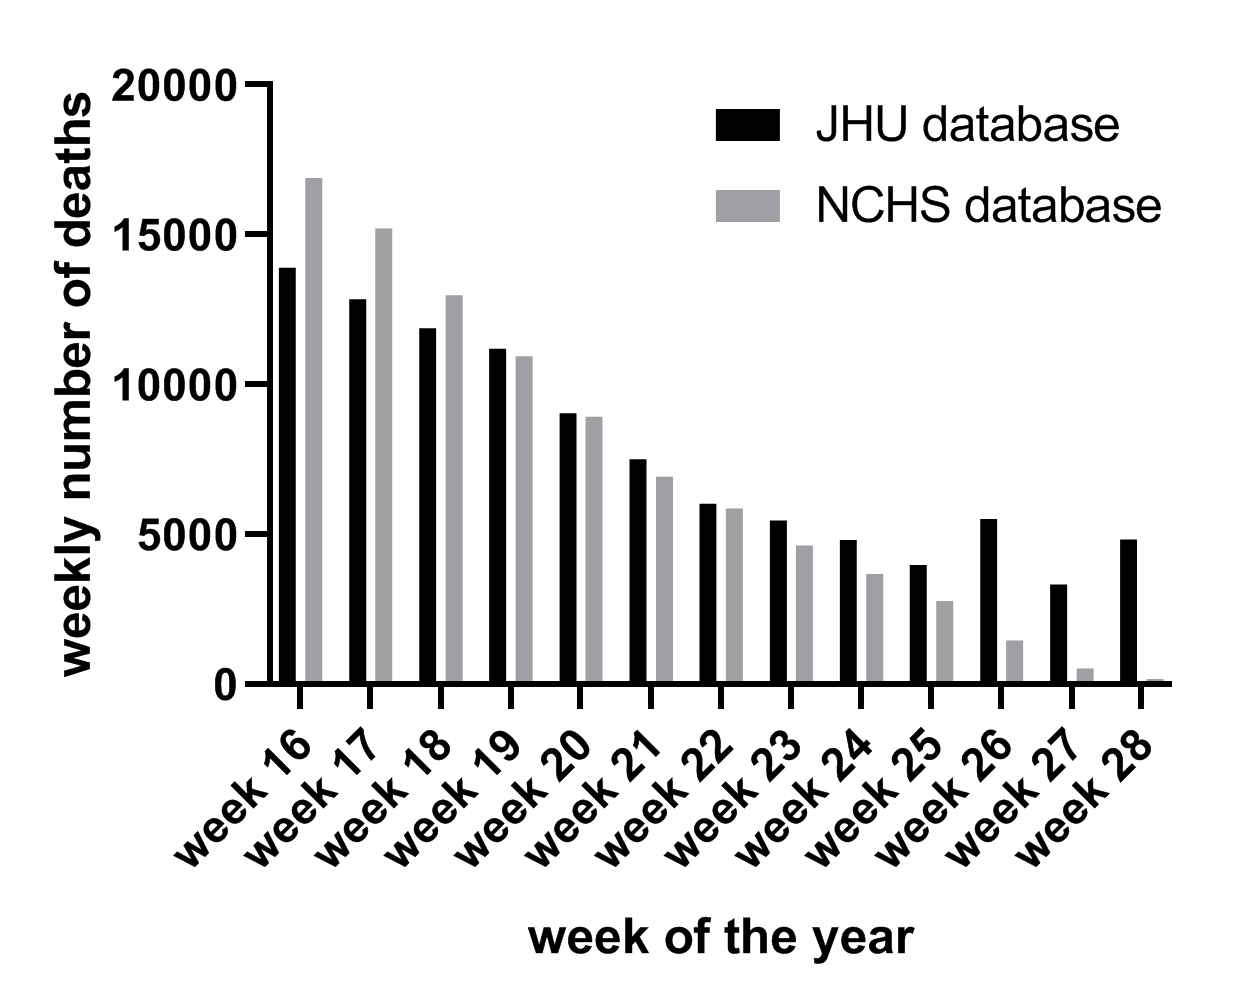
The COVID-19 Data Repository by the Center for Systems Science and Engineering at Johns Hopkins University compiles the daily numbers of COVID-19 deaths reported by U.S. states. Health Feedback aggregated these reports to produce a nationwide death count for every week and found that Johns Hopkins University reports a higher number of weekly deaths in the first weeks of July 2020 (weeks 27-28) compared to the NCHS data (Figure 2). The data also indicate a clear increase in the death count in the first two weeks of July in Arizona, California, Florida, Mississippi, Nevada, South Carolina, Tennessee, Texas and Utah, confirming the nationwide trend.

While we know that the NCHS death counts for the most recent weeks are significantly affected by underreporting, we do not have sufficient information to know whether and how data from Johns Hopkins University might be biased and whether they reflect underreporting or overreporting, for example. Thus, considering that both datasets indicate different, or even opposing trends, it strongly suggests that it is premature to claim that the deaths are nearing zero.
In summary, COVID-19-related deaths have shown a steady decline since 18 April 2020. However, analysis from successive releases of death counts by the NCHS shows that it takes at least four weeks for the NCHS to reach a relatively accurate estimate of the death counts for a given week. As a result, posts and articles basing their claims on NCHS weekly death counts from reports that are only one to three weeks old are misleading because they overlook a significant source of bias due to underreporting. In addition, other sources such as JHU report a noticeably higher death count in the first weeks of July, mostly due to a sharp increase in COVID-19-related deaths in certain states. It is thus not possible to conclude that COVID-19 deaths are about to reach zero in the weeks ahead.


